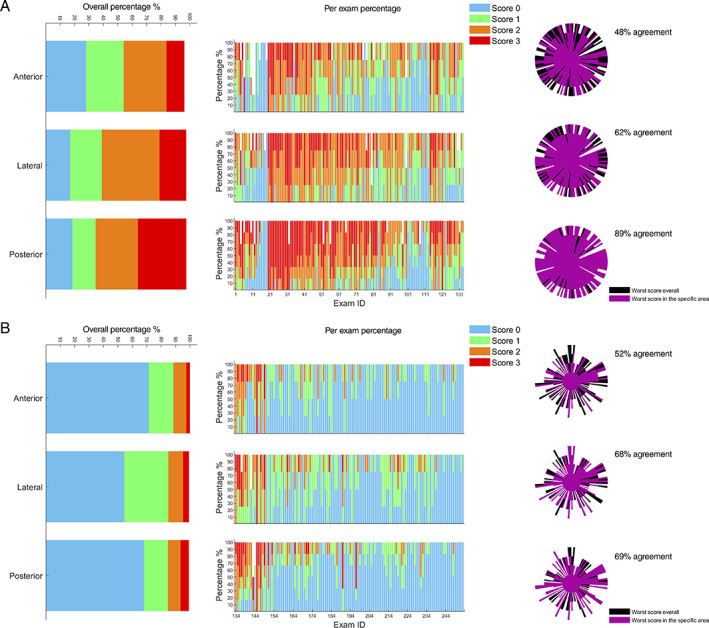
Figure 3.

A, Graphs referring to LUS exams performed on COVID‐19 patients; B, graphs referring to LUS exams performed on post‐COVID‐19 patients. The overall distributions of scores, divided per specific area (anterior, lateral, and posterior), are depicted on the left. The percentage of scores assigned for each area and for each exam is depicted in the center. The level of agreement is shown on the right. Each exam is represented by a beam of the polar plot. The score is indicated by the length of a beam. The longer the beam, the higher the score. For further details about the structure of agreement graphs see Smargiassi et al. 11 Each exam was classified according to the worst score. The reference system is system 4 (14 scanning areas).
