
Figure 6.
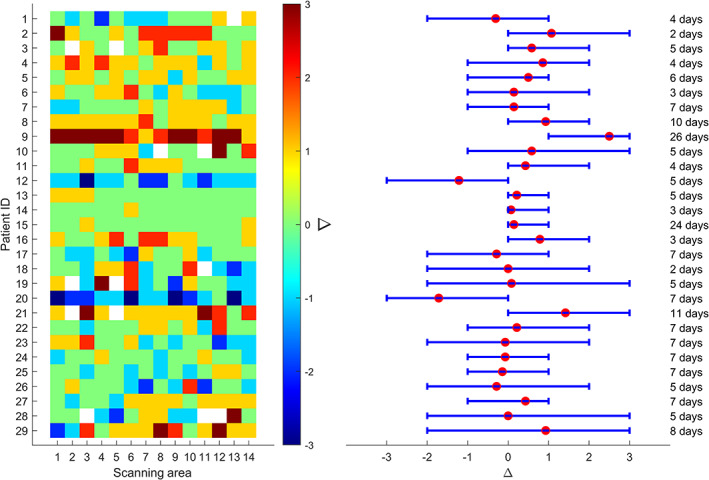
The values of Δ for each scanning area (x‐axis) and for each patient (y‐axis) that was scannied twice (on different dates) are depicted on the left. The 29 patients involved in this longitudinal study are numbered on the y‐axis from 1 to 29. The white squares indicate the absence of the measurement. On the right side, the mean value of Δ for each patient is depicted with a red point, whereas the lower and upper bounds of each error bar represent the minimum and maximum Δ of each patient, respectively. The temporal distance (days) between the two LUS exams is indicated on the right.