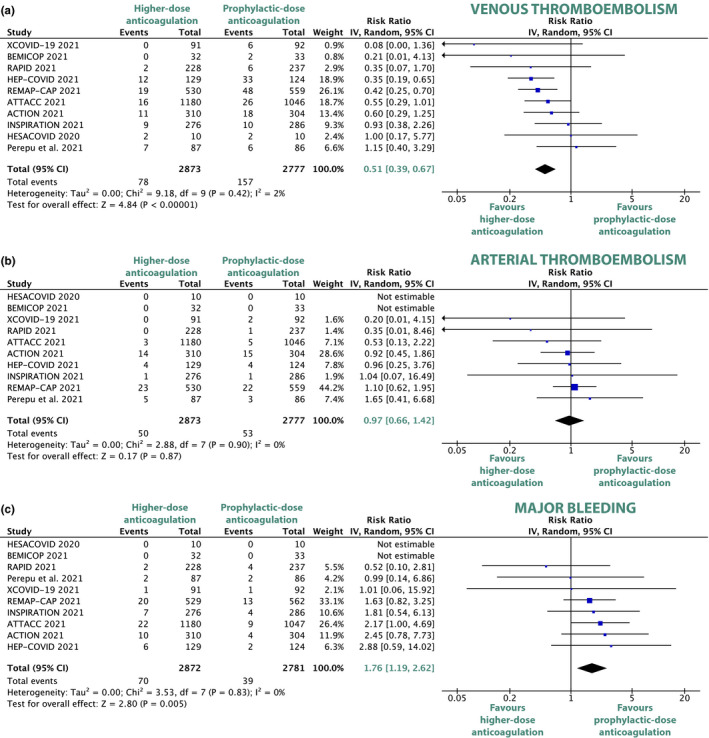
Figure 2.

Forest plots depicting risk ratios of venous thromboembolism (a), arterial thromboembolism (b), and major bleeding (c) for comparison between higher‐dose and prophylactic‐dose anticoagulation. CI, confidence interval; COVID, coronavirus disease. [Colour figure can be viewed at wileyonlinelibrary.com]
