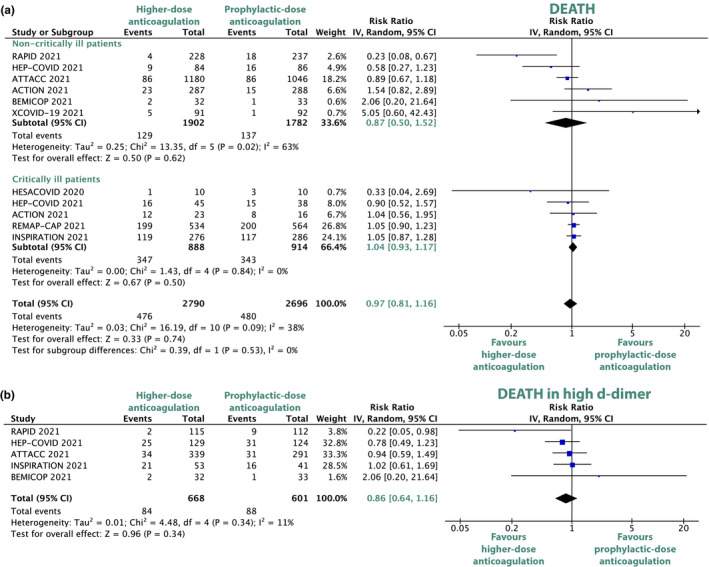
Figure 3.

Forest plots depicting risk ratios of all‐cause death in critically ill and noncritically ill patients (a) and death in patients with high d‐dimer (b). The trial by Perepu et al. included in but both critically and noncritically ill patients but did not report on all‐cause death in the respective subgroups. CI, confidence interval; COVID, coronavirus disease. [Colour figure can be viewed at wileyonlinelibrary.com]
