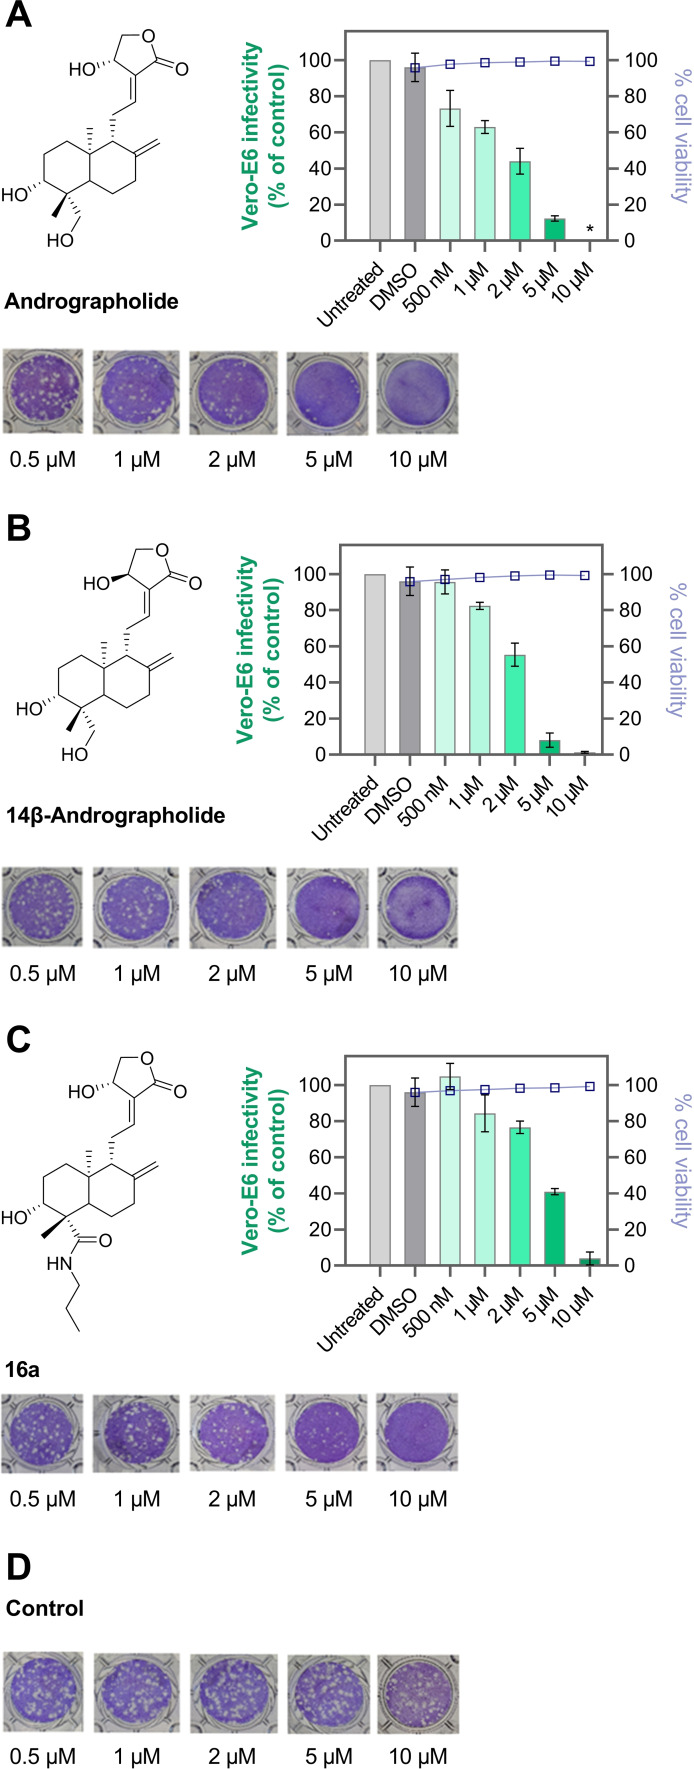
Figure 4.
Assessment of SARS‐CoV‐2 inhibition and cytotoxicity of andrographolide derivatives. Andrographolide (A), 14ß‐andrographolide (B), and 16 a (C). All compounds were titrated in triplicates between 0.5 and 10 μM. A representative well is shown for each condition. As vehicle control, DMSO (D) was used. The depicted graphs show the infectivity of the same PFU of virus relative to the untreated control wells according to the decrease in plaques. At 10 μM, 1 and 9 inhibited cell proliferation, as visible in less intense crystal violet staining of these wells. Both compounds did not show toxicity on the attached Vero‐E6 cells at any concentration and no detached cells were observed. Infectivity data represent mean ±SD of biological triplicates. Cell viability was assessed in duplicates.

