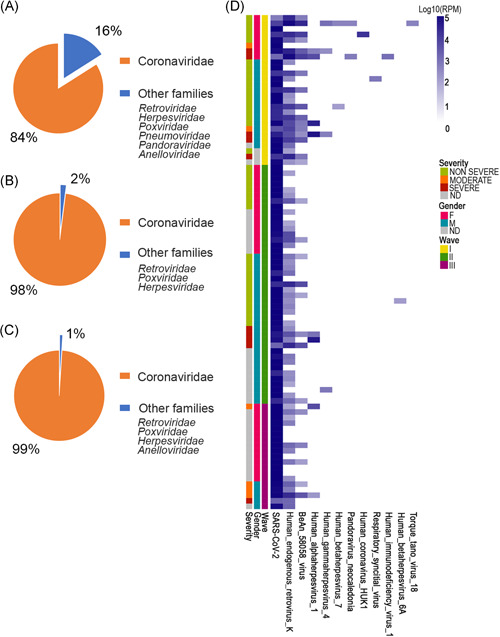
Figure 1.

Mean of RPM reads related to detected families among first (A), second (B), and third waves (C). Values are reported as the percentage of all RPM assigned to detected families in the considered period. (D) Heatmap reporting Log10 RPM values of species on entire dataset. RPM, reads per millionl SARS‐COV‐2, severe acute respiratory syndrome coronavirus 2
