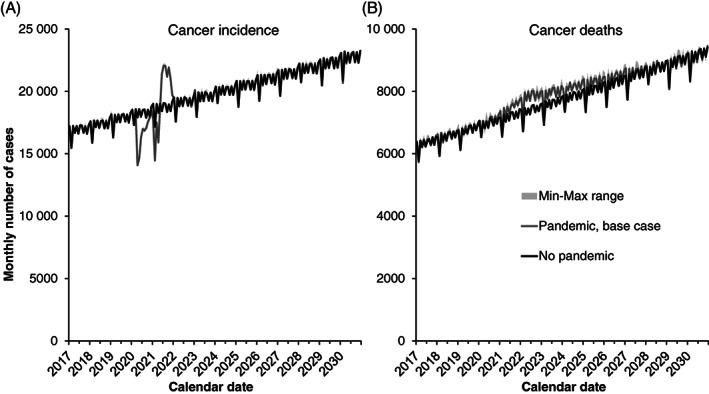
FIGURE 3.

Predicted monthly (A) cancer incidence and (B) cancer deaths for all cancer sites combined, Canada. Lines are the median of 10 stochastic simulations for each scenario, and shaded areas represent the minimum‐maximum range. The pandemic scenario assumes that treatment capacity changes occur starting in June 2021, and that each 4‐week delay in cancer care increases the rate of cancer mortality by 6% (hazard ratio of 1.06)
