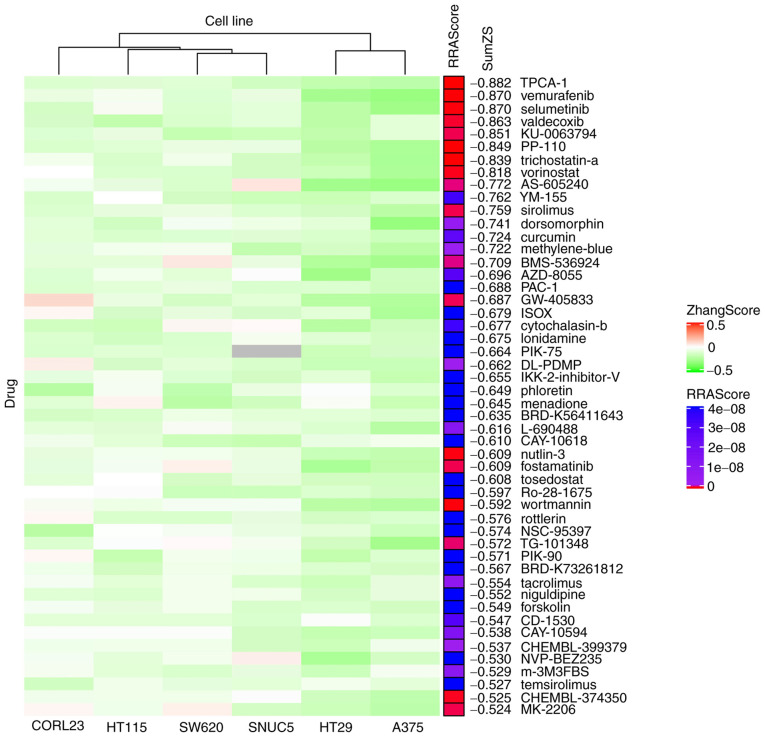
Figure 3.
Heatmap displaying the top 50 small molecules that may potentially reverse the expression changes in esophageal squamous cell carcinoma. Rows represent small molecules and columns represent cell lines (clustered by column). Red indicates positive ZhangScores, green indicates negative ZhangScores and gray indicates a lack of experimental data. The RRAScore indicates the level of significance (P-value) calculated using the RobustRankAggreg package based on the ranking results of the six cell lines. SumZS is the sum of the ZhangScore calculated in the six cell lines for each listed molecule.

