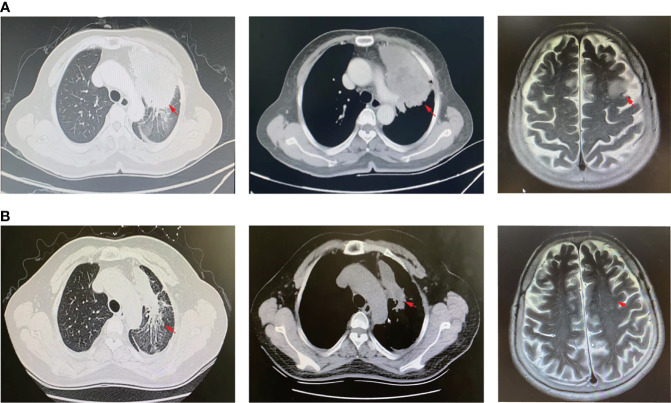
Figure 1.
CT scan and MRI images. (A) CT scan of lung lesions (left and middle panel) and MRI profile (right panel) before Savolitinib treatment. (B) CT scan of lung lesions (left and middle panel) and MRI profile (right panel) 2-months post Savolitinib treatment. The red arrow indicates the location of the lesion.

