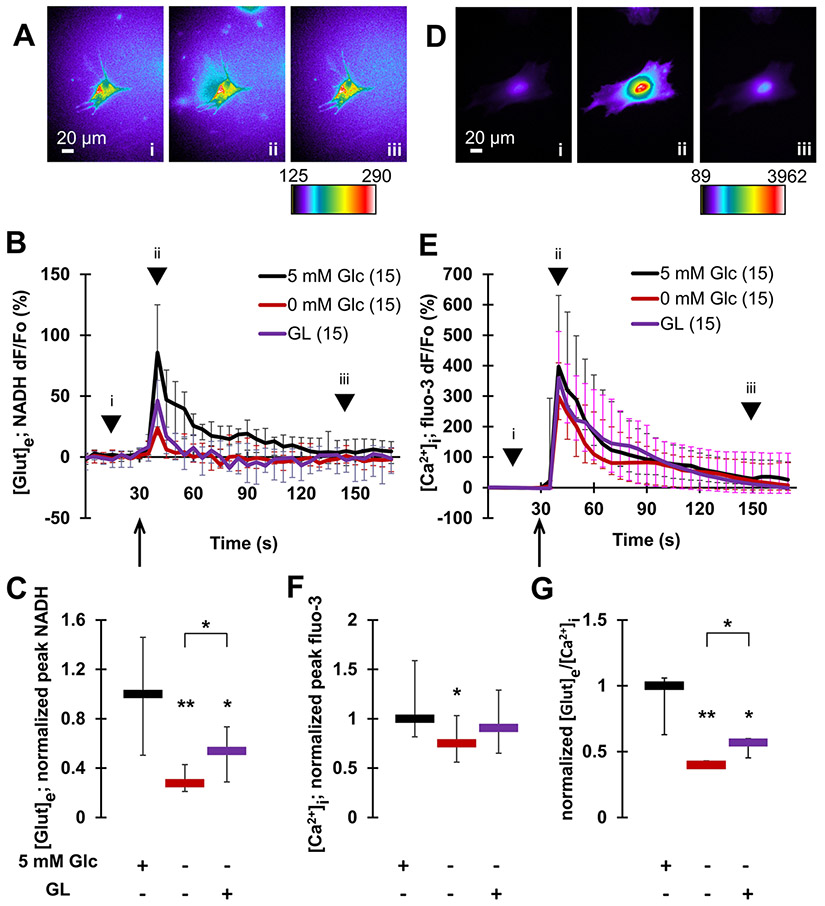
Fig. 2.
Glucose availability promotes exocytotic glutamate release from astrocytes. Mechanical stimulation induces glutamate release from (A–C), and underlying cytosolic Ca2+ elevations in (D–F), individual solitary astrocytes. A Images (raw data) of NADH signal before (i), at a peak response (ii) and after stimulation (iii). The pseudo color scale is a linear representation of the NADH fluorescence intensities ranging from 125 to 290 intensity units (i.u.). Scale bar, 20 μm. B Time lapse of extracellular NADH fluorescence dynamics in immediate vicinity of individual astrocytes, reporting on glutamate release from these glial cells. Changes in NADH fluorescence are shown as dF/Fo (percentage) after background subtraction and correction for bleaching. Mechanical stimulation of normoglycemic astrocytes (5 mM Glc) caused glutamate release from these cells. This release was greatly reduced in aglycemic astrocytes (0 mM Glc). There was a partial recovery from this reduction observed in astrocytes subjected to the glycogenolysis (GL) protocol, which recruited glucose from the intracellular glycogen store. Arrow indicates the time point when mechanical stimulation was applied, while arrowheads correspond to acquisition time points of images shown in (A). C Summary of normalized peak NADH responses shown in B. D In experiments parallel to those in A–C, astrocytes were mechanically stimulated while measuring cytosolic Ca2+ levels using fluo-3. This stimulation causes increases of cytosolic Ca2+ in astrocytes. Images (raw data) of cytosolic fluo-3 signal before (i), at a peak response (ii) and after stimulation (iii). The pseudo color scale is a linear representation of the fluo-3 fluorescence intensities in astrocytes ranging from 89 to 3962 i.u.; scale bar, 20 μm. E Time lapse of fluo-3 fluorescence dynamics reporting on cytosolic Ca2+ levels in astrocytes. Changes in fluo-3 fluorescence are shown as dF/Fo (percentage) after background subtraction. Mechanical stimulation caused an increase of cytosolic Ca2+ levels in normoglycemic astrocytes. This increase was marginally reduced in aglycemic astrocytes, but not in astrocytes lacking external glucose subjected to the GL protocol. Other annotations as in B. F Summary of normalized peak fluo-3 responses shown in B. G The ratio of glutamate release and cytosolic Ca2+ responses reveals a significant decrease in the ratio in aglycemic astrocytes when compared to normoglycemic controls. This decrease was partially rescued in astrocytes subjected to the GL protocol. All data points in graphs are shown as medians with interquartile ranges (IQRs). Number of astrocytes studied in each condition is given in parentheses in B and E. In C, F and G, charts below graphs indicate the presence (+) or absence (−) of a compound and/or a treatment. Asterisks indicate a statistical difference compared to the control/normoglycemic group. The brackets mark other differences. Significance was established using Kruskal–Wallis one-way ANOVA (KWA) followed by Newman-Keuls post-hoc test for multiple comparisons (NKT) **p ≤ 0.01, *p ≤ 0.05

