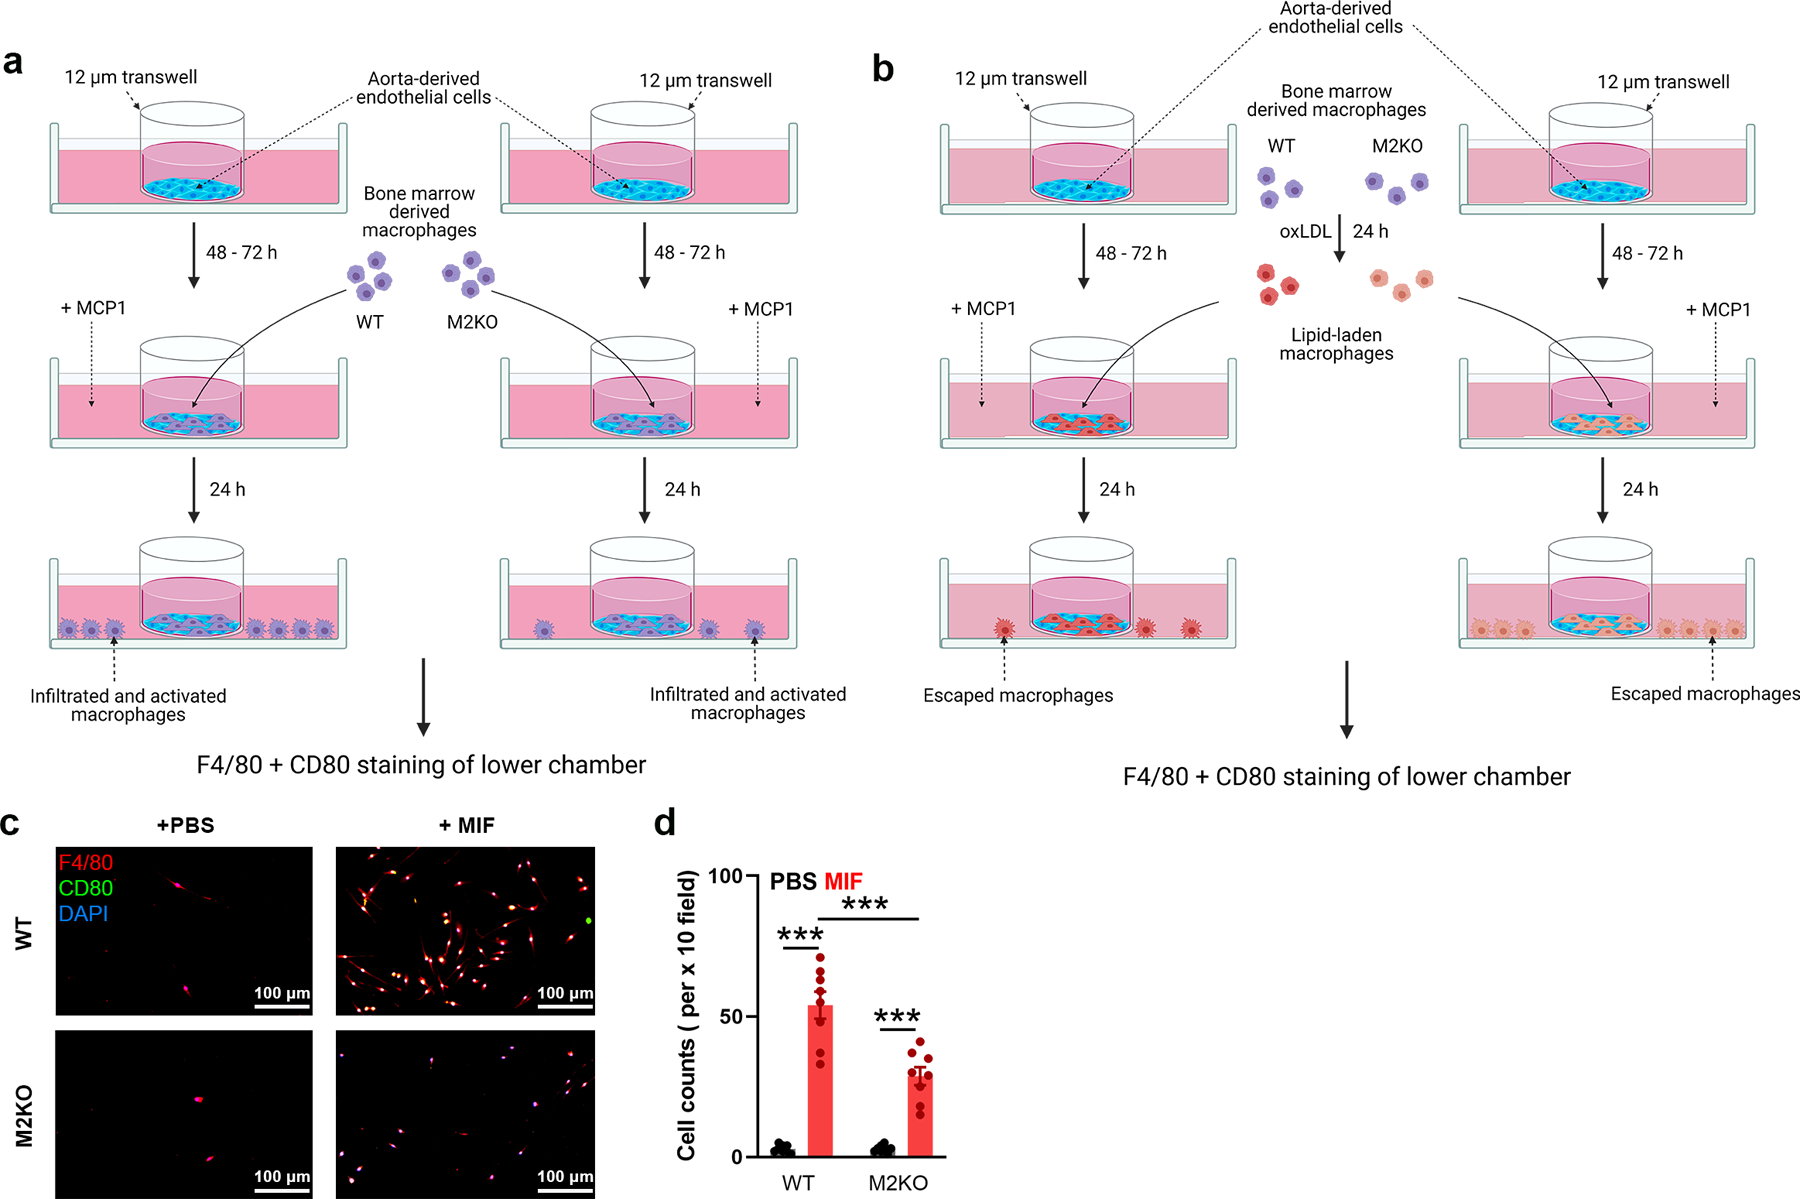
Extended Data Fig. 3. In vitro macrophage migration and emigration assay.

(a) Graphic illustration of in vitro examination of macrophage infiltration across endothelial cells induced by MCP1. Aorta-derived endothelial cells were plated on the transwell inserts (pore size: 12 μm) for 3–5 days. Bone marrow derived macrophages were added into the upper chamber after endothelial cells completely covered the upper surface of transwells. After 4 h, F4/80 and CD80 staining of macrophages in the lower chamber was performed as in Fig 2l. (b) Graphic illustration of in vitro examination of macrophage emigration across endothelial cells induced by MCP1. Aorta-derived endothelial cells were plated on the transwell inserts (pore size: 12 μm) for 3–5 days. Bone marrow derived macrophages preloaded with oxLDL for 24 h were added into the upper chamber after endothelial cells completely covered the upper surface of transwells. After 24 h, F4/80 and CD80 staining of macrophages in lower chamber was performed as in Fig 2n. (c, d) In vitro macrophage migration assay induced by MIF instead of MCP1 as shown in Extended Data Fig. 3a. l, F4/80 and CD80 staining of macrophages in the lower chamber (Red: F4/80; Blue: DAPI; Green: CD80). c, Quantification of the number of infiltrated macrophages within a x 10 field. 6 dishes from each group were chosen for quantification. (***: p < 0.001; ANOVA, two-tailed, Bonferroni’s test; mean ± SEM).
