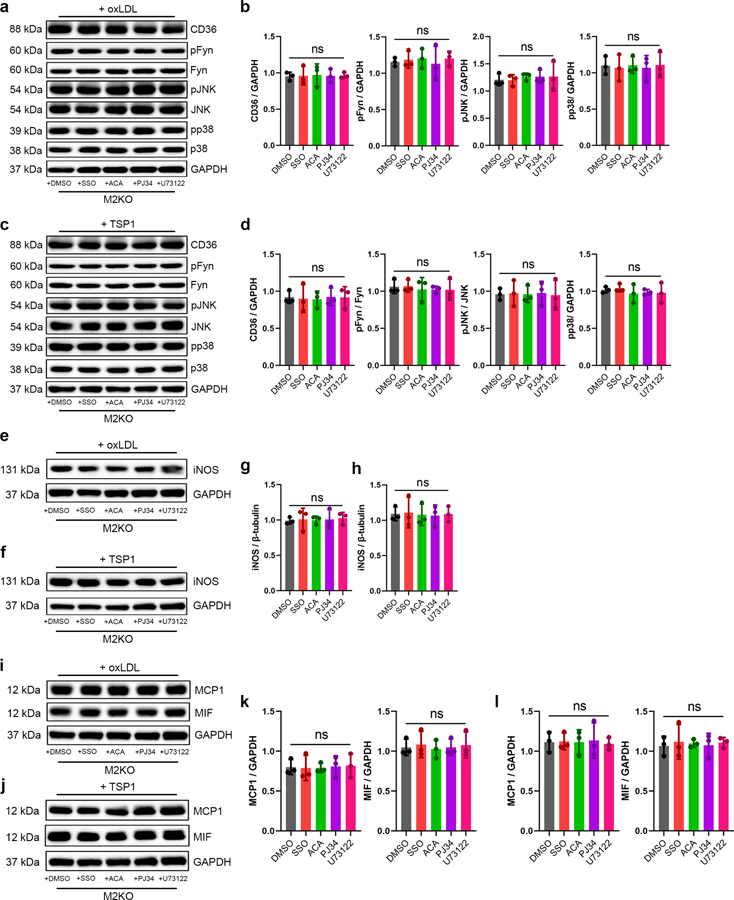
Extended Data Fig. 7. Inhibition of CD36 or TRPM2 did not produce additional inhibitory effect on M2KO macrophages.
(a) Representative WB analysis of the expression of CD36, pFyn, Fyn, pJNK, JNK, pp38 and p38 in isolated macrophages from M2KO mice after oxLDL treatment (50 μg/ml). Macrophages were treated with different inhibitors as indicated before protein extraction. (b) Quantification of WB bands (n=3/group). (c) Representative WB analysis of the expression of CD36, pFyn, Fyn, pJNK, JNK, pp38 and p38 in isolated macrophages from M2KO mice after TSP1 treatment (10 μg/ml). Macrophages were treated with different inhibitors as indicated before protein extraction. (d) Quantification of WB bands (n=3/group). (e) Representative WB analysis of the expression of iNOS in isolated macrophages from M2KO mice after oxLDL treatment (50 μg/ml). Macrophages were treated with different inhibitors as indicated before protein extraction. (f) Quantification of WB bands (n=3/group). (e) Representative WB analysis of the expression of iNOS in isolated macrophages from M2KO mice after TSP1 treatment (10 μg/ml). Macrophages were treated with different inhibitors as indicated before protein extraction. (f) Quantification of WB bands (n=3/group). (i) Representative WB analysis of the expression of MCP1 and MIF in isolated macrophages from M2KO mice after oxLDL treatment (50 μg/ml). Macrophages were treated with different inhibitors as indicated before protein extraction. (j) Quantification of WB bands (n=3/group). (k) Representative WB analysis of the expression of MCP1 and MIF in isolated macrophages from M2KO mice after TSP1 treatment (10 μg/ml). Macrophages were treated with different inhibitors as indicated before protein extraction. (l) Quantification of WB bands (n=3/group). (ns: no statistical significance; ANOVA, two-tailed, Bonferroni’s test; mean ± SEM).

