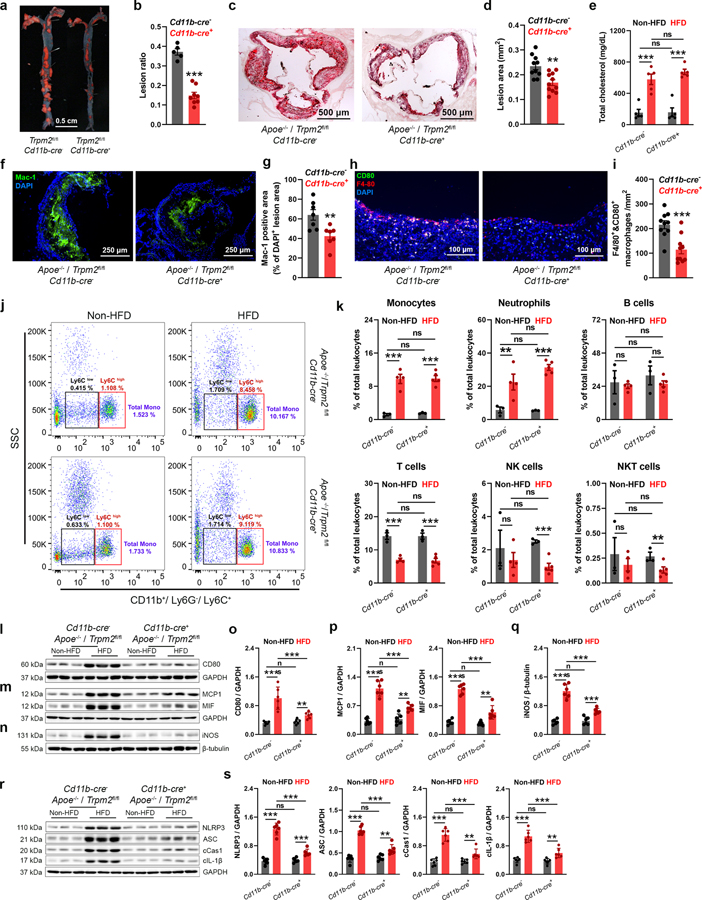
Fig. 3: Trpm2 deletion in macrophages protects mice against atherosclerosis.
(a,b) Trpm2 deletion in Cd11b expressing cells (Trpm2fl/flCd11b-cre+) inhibited atherosclerotic plaque formation. a, Representative images of Oil Red O (ORO) staining of full-length aorta (red areas represents plaque). b, Mean atherosclerotic lesion ratio based on ORO staining from Trpm2fl/flCd11b-cre− (n=5) and Trpm2fl/flCd11b-cre+ mice (n=8), P < 0.0009. (c, d) Representative images and quantification of ORO staining of the aortic root sections from Trpm2fl/flCd11b-cre− (n=9) and Trpm2fl/flCd11b-cre+ mice (n=10), P = 0.0016. (e) Trpm2fl/flCd11b-cre+ did not influence the total cholesterol level in serum (n=5/group) (HFD: high-fat diet). (f-i) Trpm2fl/flCd11b-cre+ reduced macrophage burden in atherosclerotic plaque. f, g Representative merged images (Blue:DAPI; Green: Mac-1) and quantification of Mac-1 staining of aortic root sections from Trpm2fl/flCd11b-cre− (n=8) and Trpm2fl/flCd11b-cre+ mice (n=7), P = 0.0071. (h, i) Representative merged images and quantification of F4/80 and CD80 staining of aorta cross-sections using the plaques areas as shown in Extended Data Fig. 1f (Red: F4/80; Blue: DAPI; Green: CD80) from Trpm2fl/flCd11b-cre− (n=9) and Trpm2fl/flCd11b-cre+ mice (n=10), P = 0.0005. (j, k) Trpm2fl/flCd11b-cre+ did not influence the leukocyte population in the peripheral blood. j, Representative monocyte population identified using flow cytometry. Ly6C+ monocyte population was identified from CD11b+ and Ly6G− leukocytes. k, Quantification of monocyte, neutrophil, B cell, T cell, NK cell and NKT cell population in the peripheral blood from Trpm2fl/flCd11b-cre− (n=3) and Trpm2fl/flCd11b-cre+ mice (n=4) with or without HFD treatment. (l, o) Representative WB analysis and quantification of the CD80 expression in aorta (n= 6 mice/group). (m, p) Representative WB analysis and quantification of the expression of MCP1 and MIF in aorta (n= 6 mice/group). (n, q) Representative WB analysis and quantification of iNOS expression in aortas (n= 6 mice/group). (r, s) Representative WB analysis and quantification of the expression of NLRP3, ASC, cleaved caspase-1 (cCas1), and cleaved IL-1β (cIL-1β) expression in aortas (n= 6 mice/group). (ns: no statistical significance; **: p < 0.01; ***: p < 0.001; ANOVA, two-tailed, Bonferroni’s test; mean ± SEM).

