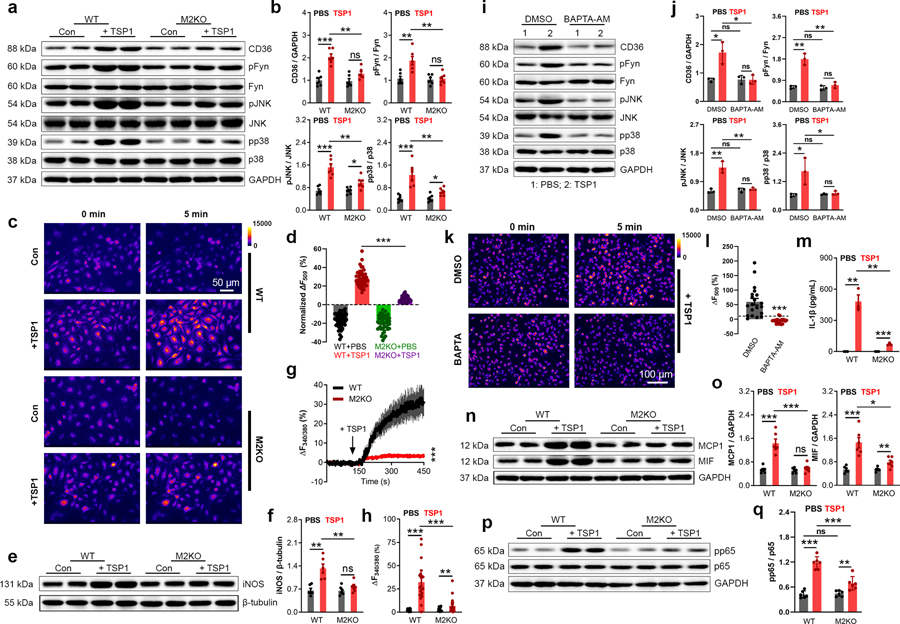
Fig. 5: Trpm2 deletion inhibits the activation of CD36 signaling by TSP1.
(a, b) Representative WB analysis of CD36, pFyn, pJNK and pp38 expression in macrophages. (c, d) c, Representative R123 imaging before and 5 min after TSP1 treatment in macrophages. Control group (Con: PBS treatment) was used to show the rapid photo bleaching of R123. d, Quantification of changes of R123 fluorescence 5 min after TSP1 treatment. WT (n=45 for TSP1 treatment, n=47 for control) and M2KO (n=43 for TSP1 treatment, n=47 for control) macrophages were from 4 dishes of cultured macrophages isolated from 4 mice/group. (e, f) Representative WB of iNOS expression in isolated macrophages treated with TSP1 (10 μg/ml). (g), Representative real-time ratio Ca2+ imaging traces during TSP1 treatment. The averaged traces were from 10 macrophages randomly chosen from a representative culture dish of each group. (h), Quantification of Fura-2 fluorescence changes 5 min after TSP1 treatment. WT (n=20 for TSP1 treatment, n=20 for control) and M2KO (n=20 for TSP1 treatment, n=20 for control) macrophages were from 3 dishes of cultured cells isolated from 3 mice in each group. (i, j) Representative WB of CD36, pFyn, pJNK and pp38 expression in macrophages after treatment with TSP1 and DMSO or BAPTA-AM (1 μM), an intracellular Ca2+ chelator (n=3/group). (k, l) k, Representative images of R123 imaging in macrophages before and 5 min after oxLDL treatment with DMSO or BAPTA-AM (1 μM) preloading for 30 min. l, Quantification of R123 fluorescence changes 5 min after TSP1 treatment (n=20/group). (m) Measurement of IL-1β level in culture medium after TSP1 treatment using ELISA. (n, o) Representative WB of MCP1 and MIF expression in macrophages (n=6/group). (p, q) Representative WB analysis and quantification of pp65 expression in macrophages (n=6/group). (TSP1 (10 μg/ml) was treated for 24 h for all the WB analysis; ns: no statistical significance; *: p < 0.05; **: p < 0.01; ***: p < 0.001; ANOVA, two-tailed, Bonferroni’s test; mean ± SEM).

