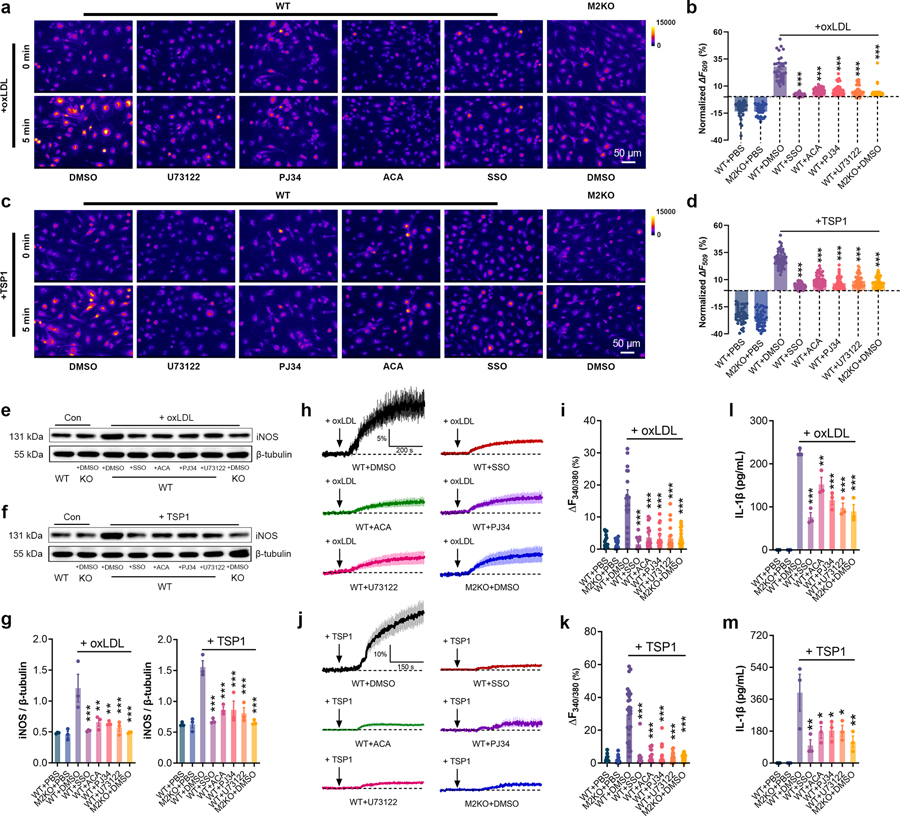
Fig. 7: TRPM2 mediates macrophage activation induced by oxLDL or TSP1.
(a-d) Representative picture of Rhodamine-123 real-time imaging of macrophages before and 5 min after oxLDL treatment (50 μg/ml) as in a, and 5 min after TSP1 treatment (10 μg/ml) as in c in isolated macrophages. Quantification of changes of R123 fluorescence 5 min after oxLDL treatment as in b, and 5 min after TSP1 treatment as in d. For oxLDL treatment, WT (n=40 for PBS, n=38 for DMSO, n=35 for SSO, n=38 for ACA, n=39 for PJ34, n=44 for U73122) and M2KO (n=38 for PBS, n=35 for DMSO) macrophages were from 4 dishes of cultured cells isolated from 3 mice in each group. For TSP1 treatment, WT (n=48 for PBS, n=50 for DMSO, n=53 for SSO, n=51 for ACA, n=57 for PJ34, n=56 for U73122) and M2KO (n=48 for PBS, n=52 for DMSO) macrophages were from 4 dishes of cultured cells isolated from 3 mice in each group. (e-g) Representative WB analysis of iNOS expression in isolated macrophages. 3 dishes of cells from 3 mice from each group were chosen for quantification. (h-k) Representative real-time Fura-2 Ca2+ imaging traces during oxLDL (50 μg/ml) as in h, and during TSP1 treatment (10 μg/ml) as in j. The averaged traces were from 10 macrophages randomly chosen from a representative culture dish of each group. Quantification of fluorescence changes 5 min after oxLDL treatment as in i, and 5 min after TSP1 treatment as in k. For oxLDL treatment and TSP1 treatment, 20 macrophages in each group from 3 dishes isolated from 3 mice were chosen for quantification. (l, m) Measurement of IL-1β level in culture medium of isolated macrophages after the treatment of oxLDL (50 μg/ml) or TSP1 (10 μg/ml) for 24 h using ELISA. 3 dishes of cells from 3 mice from each group were chosen for quantification. (*: p < 0.05; **: p < 0.01; ***: p < 0.001; ANOVA, two-tailed, Bonferroni’s test; mean ± SEM)

