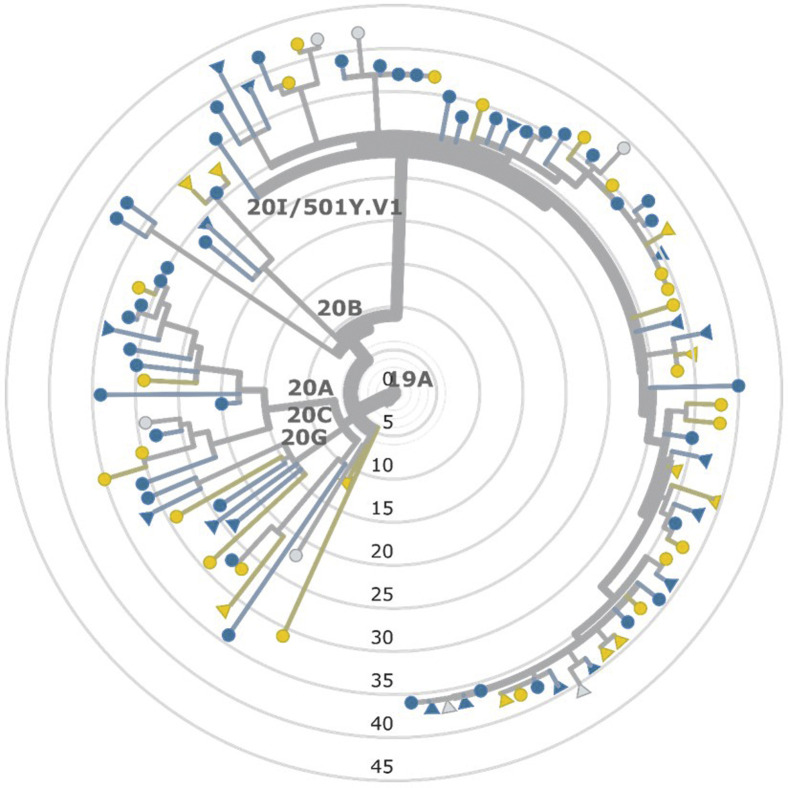
Figure 8.
Phylogenetic tree of representative SARS-CoV-2 genomes obtained from households in a COVID-19 household transmission investigation, by age and SIR, California and Colorado, January to April 2021. Sequence data were obtained for 212 household members from 104 households. Circles denote adult primary cases (n = 73); triangles denote pediatric primary cases (n = 31). A SIR of 50% or greater was binned as high and represented in blue (n = 62); a SIR of less than 50% was binned as low and represented in yellow (n = 35); gray denotes the absence of susceptible contacts within the household (n = 7).

