Figure 4.

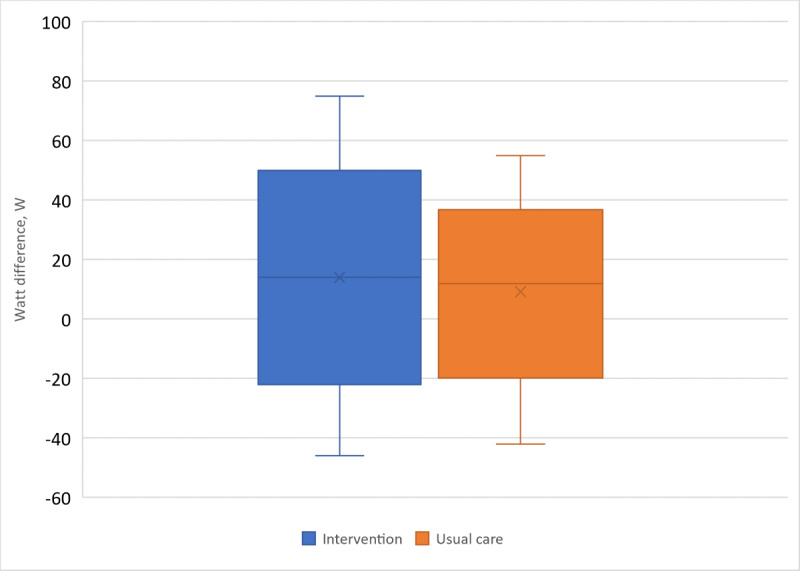
A boxplot of the change in submaximal exercise capacity in the intervention group and the usual care group. The difference in change in exercise capacity among the groups was nonsignificant.

A boxplot of the change in submaximal exercise capacity in the intervention group and the usual care group. The difference in change in exercise capacity among the groups was nonsignificant.