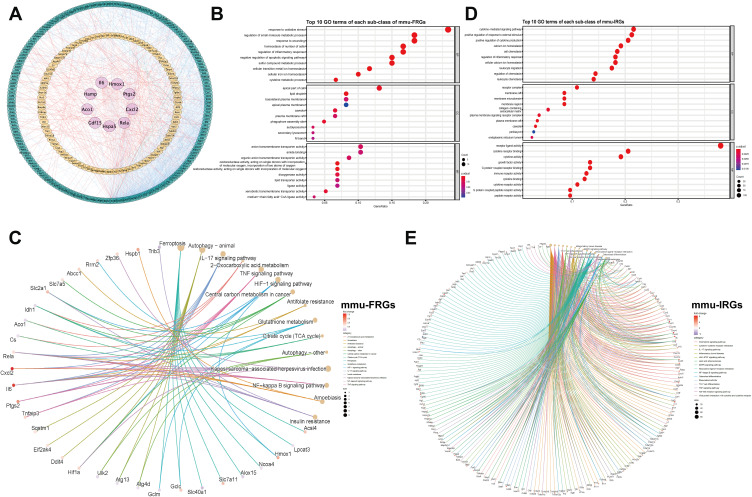
Figure 3.
Protein–protein interaction (PPI) networks of mmu-FRGs and mmu-IRGs (A) Green circle, FRGs; Orange circle, IRGs; Purple circle, hub genes which appeared in both FRGs and IRGs; Orange lines, protein-protein regulating relations; blue lines, interactions within hub genes and FRGs and IRGs. Dotplot of GO analysis of mmu-FRGs (B) and mmu-IRGs (D) (top 10 results of each). Cnetplot of KEGG analysis (top 15 results) of mmu-FRGs (C) and mmu-IRGs (E).

