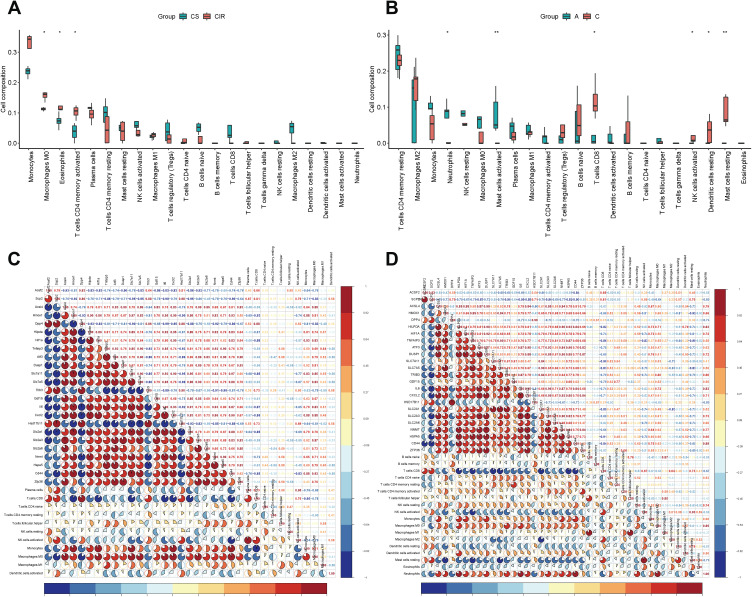
Figure 5.
The boxplot of immune cell infiltration analysis of mouse intestine (A) and human intestine (B) after intestinal I/R injury. The horizontal axis represents cell types, and the vertical axis represents the estimated proportion. Spearman correlation analysis of expression profile of coFRGs and immune cell infiltration matrix from mice (C) and humans (D). Red represents positive correlation, blue represents negative correlation, and the number and the area of the pie chart represents correlation coefficient. The stronger the correlation, the darker is the color, and the larger is the area of the pie chart. *p < 0.05, **p < 0.01.

