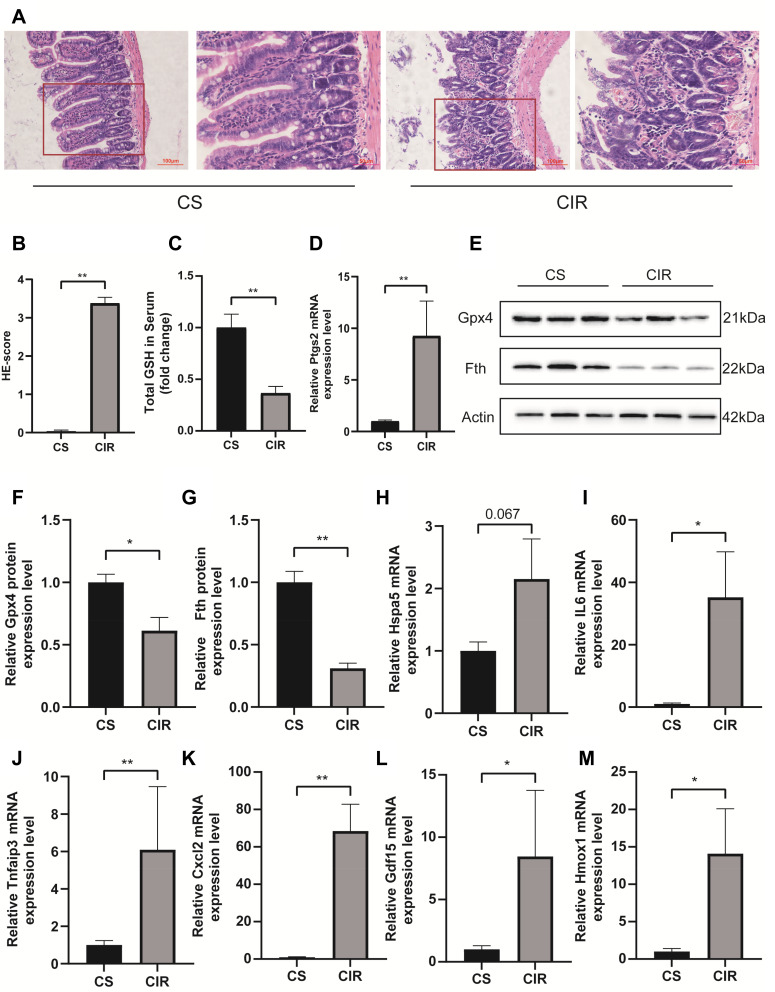
Figure 6.
H&E staining and histological injury scoring (Chiu’s score) of the intestinal mucosa (A and B). Red boxed areas are shown in higher magnification. Magnification 400×, bar = 50µm, magnification 200×, bar=100μm (n = 5). The glutathione (GSH) levels in serum (C). Relative mRNA expression of Ptgs2 (D), the expression level of Fth and Gpx4 in the small intestine (E–G). Relative expression of mRNA by qRT-PCR (n = 4–6) (H–M). The results are expressed as the mean ± SEM. *p < 0.05, **p < 0.01.

