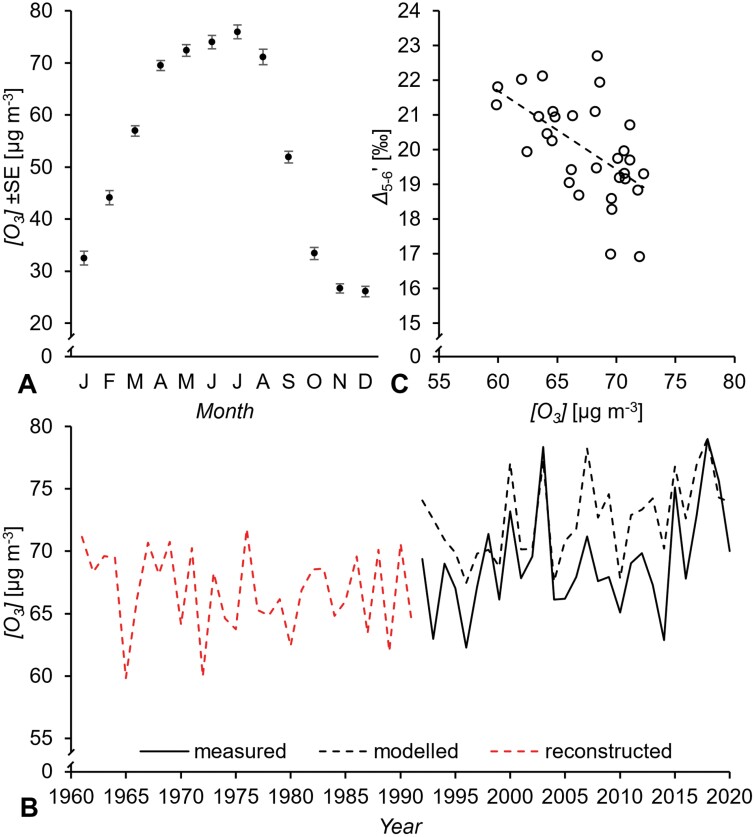
Fig. 6.
(A) Average monthly ozone concentrations, [O3], measured in Vienna over the period 1992–2020. (B) April to September [O3] in Vienna. Black solid line, measured [O3]; black and red dashed lines, modelled and reconstructed [O3], respectively, based on the relationship of [O3] with sunshine duration, SD, and relative humidity, rH: [O3]=58.28 + 0.02951SD–0.3697rH, R2=0.59, P<0.00001, n=29. (C) 13C discrimination at glucose C-5 and C-6, Δ5–6ʹ, as a function of [O3]: Δ5–6ʹ=35.24–0.2258[O3], R2=0.33, P<0.001, n=31. Isotope data were measured on tree-ring glucose of Pinus nigra laid down from 1961 to 1995 at a dry site in the Vienna basin. SD and rH were measured at the climate station Hohe Warte (Vienna). [O3] was measured at five stations in Vienna (Stephansplatz, Laaer Berg, Hermannskogel, Hohe Warte, and Lobau).

