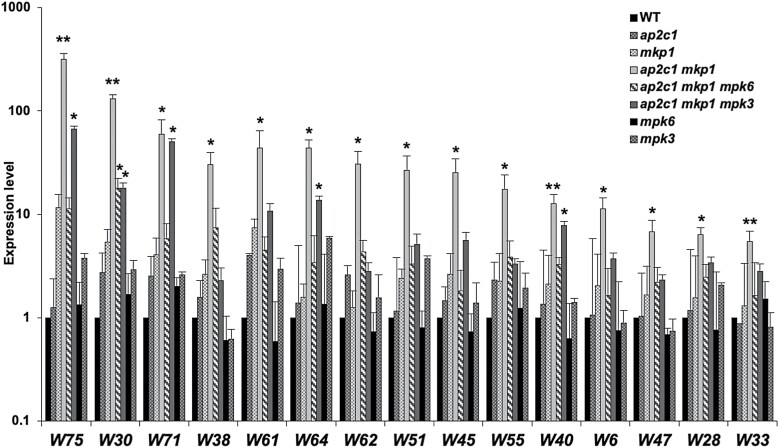
Fig. 5.
Expression of WRKY-encoding genes. The transcript levels of WRKY-encoding (W) genes were quantified by RT–qPCR in plants of the indicated genotypes and compared with the WT (expression levels in the WT were set to 1). Bars represent mean ±SD values of three replicates. Data are plotted on a log10 scale after normalization over WT values. ∗P<0.05, ∗∗P<0.01 (Mann–Whitney U test).

