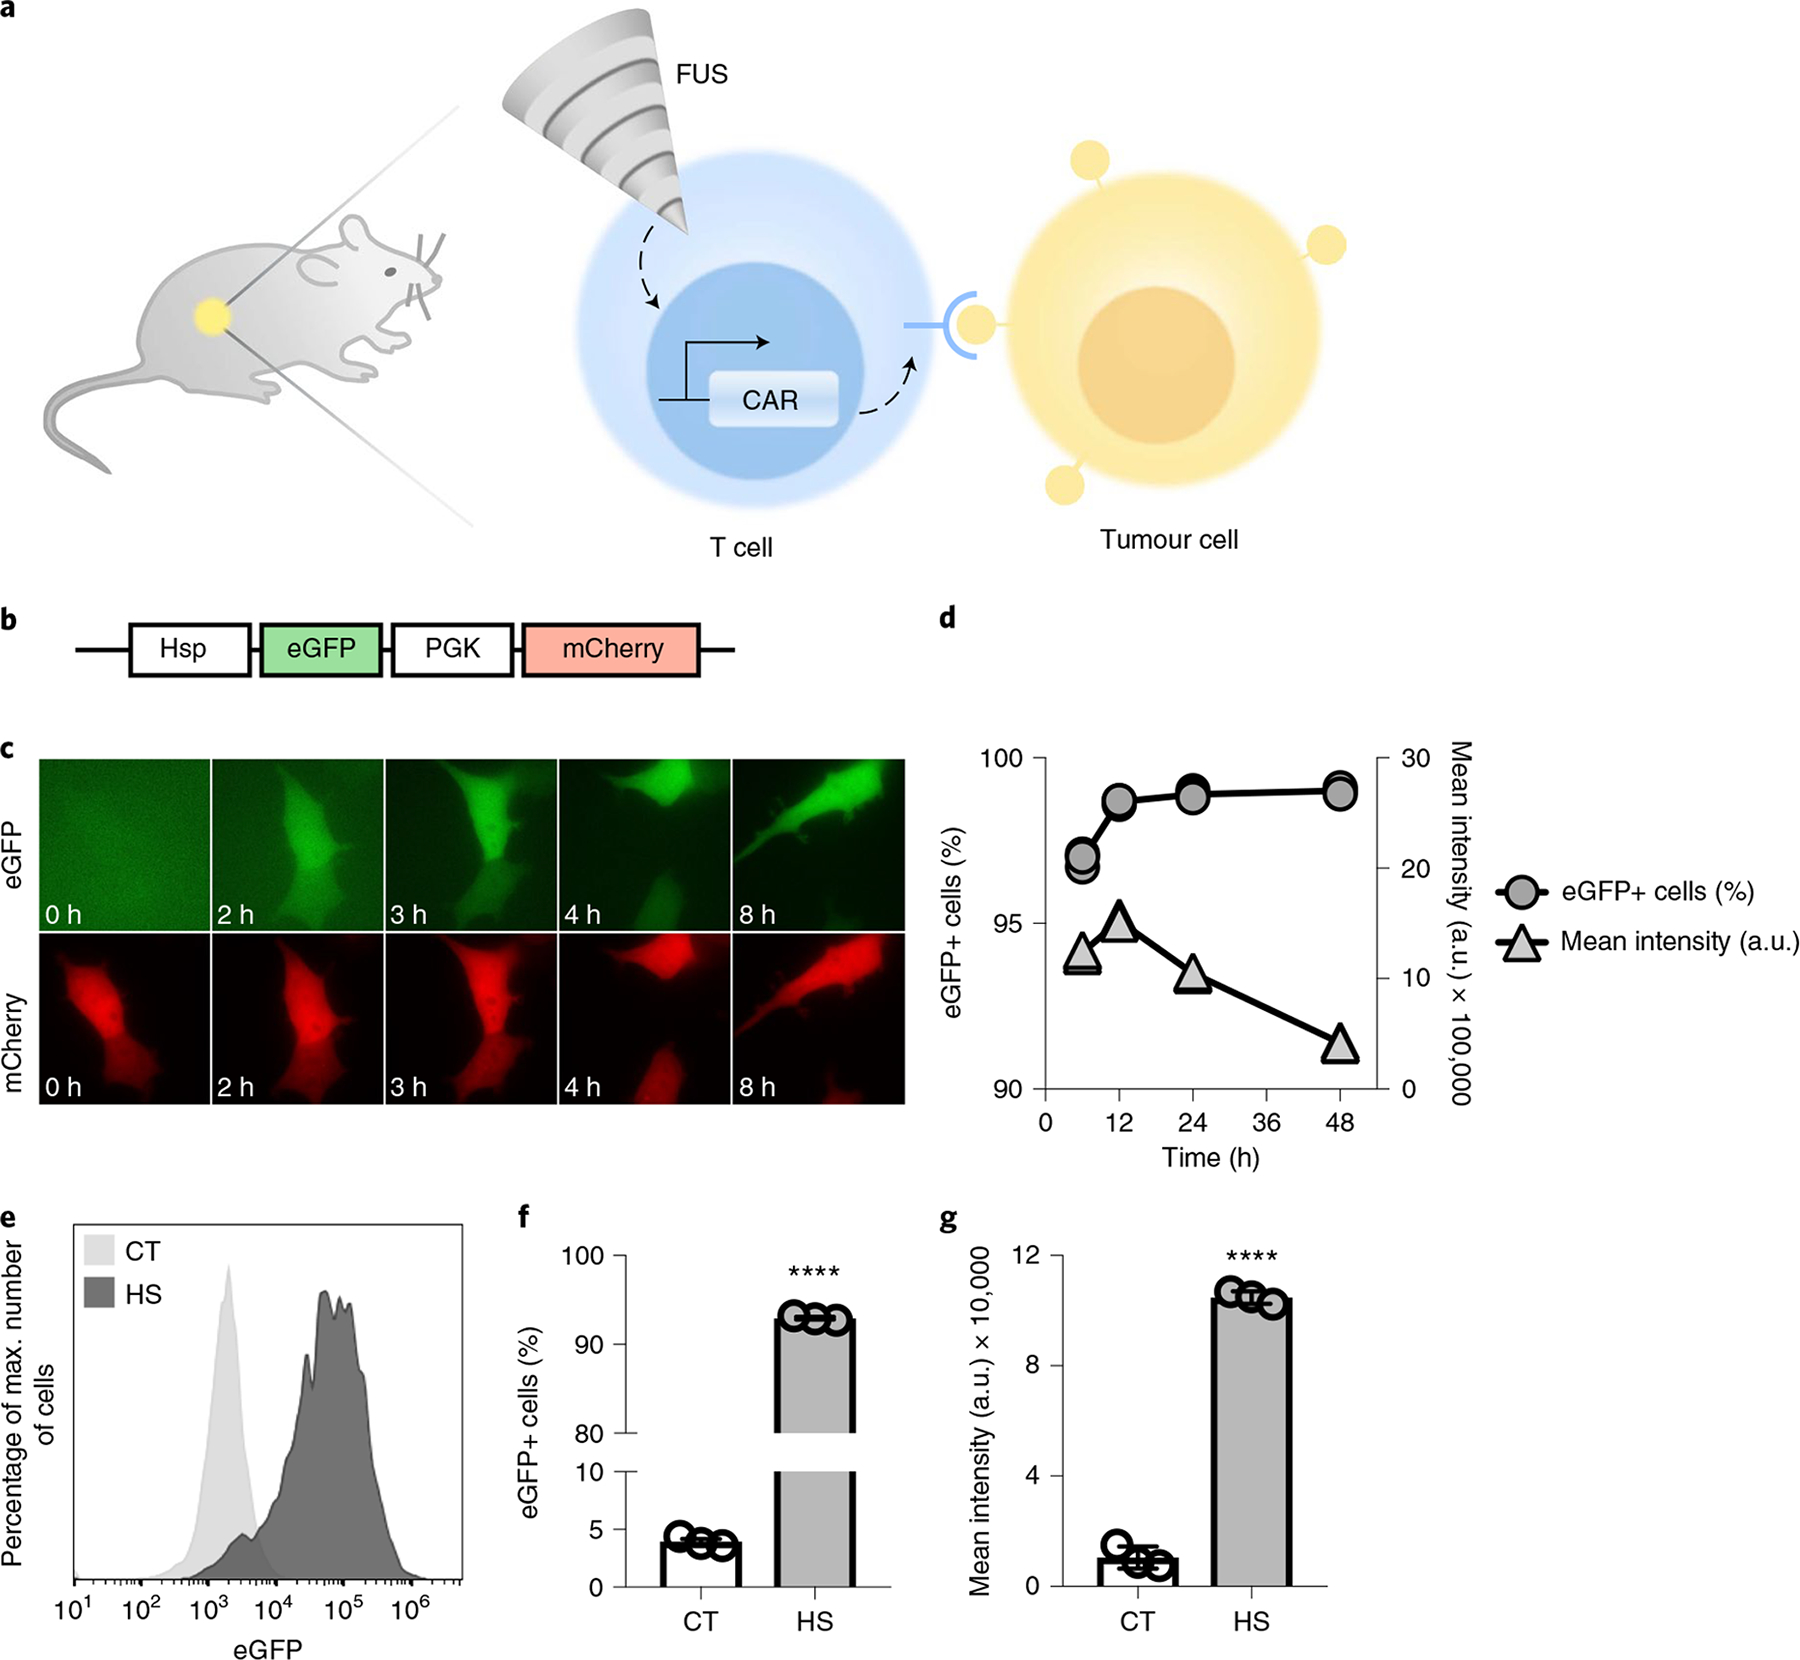
Fig. 1 |. Heat-inducible gene activation.

a, Design of the FUS-CAR-T-cell therapy technology. MRI-guided FUS induces localized activation of FUS-CAR-T cells to recognize and eradicate target tumour cells. b, Schematics of the dual-promoter eGFP reporter. c,d, HEK293 T cells containing the dual-promoter reporter received a 15 min, 43 °C HS at t = 0 h. Shown are fluorescent images of inducible eGFP and constitutive mCherry (c) and the percentages of eGFP+ cells and their mean fluorescence intensities (d). e–g, Gene induction in primary human T cells with the dual-promoter eGFP reporter. Shown are representative flow cytometry profiles of eGFP expression (e), the percentages of eGFP+ cells (****P = 5.5 × 10⁻¹⁴) (f) and their mean fluorescence intensities (****P = 5.0 × 10⁻¹⁰) (g). Plots in f and g are parts of complete bar graphs shown in Supplementary Fig. 3d,e, with one-way analysis of variance (ANOVA) followed by Tukey’s multiple comparisons test. Bar heights and error bars represent means of three biological replicates ± s.e.m. mCherry+ cells were gated for eGFP expression analysis.
