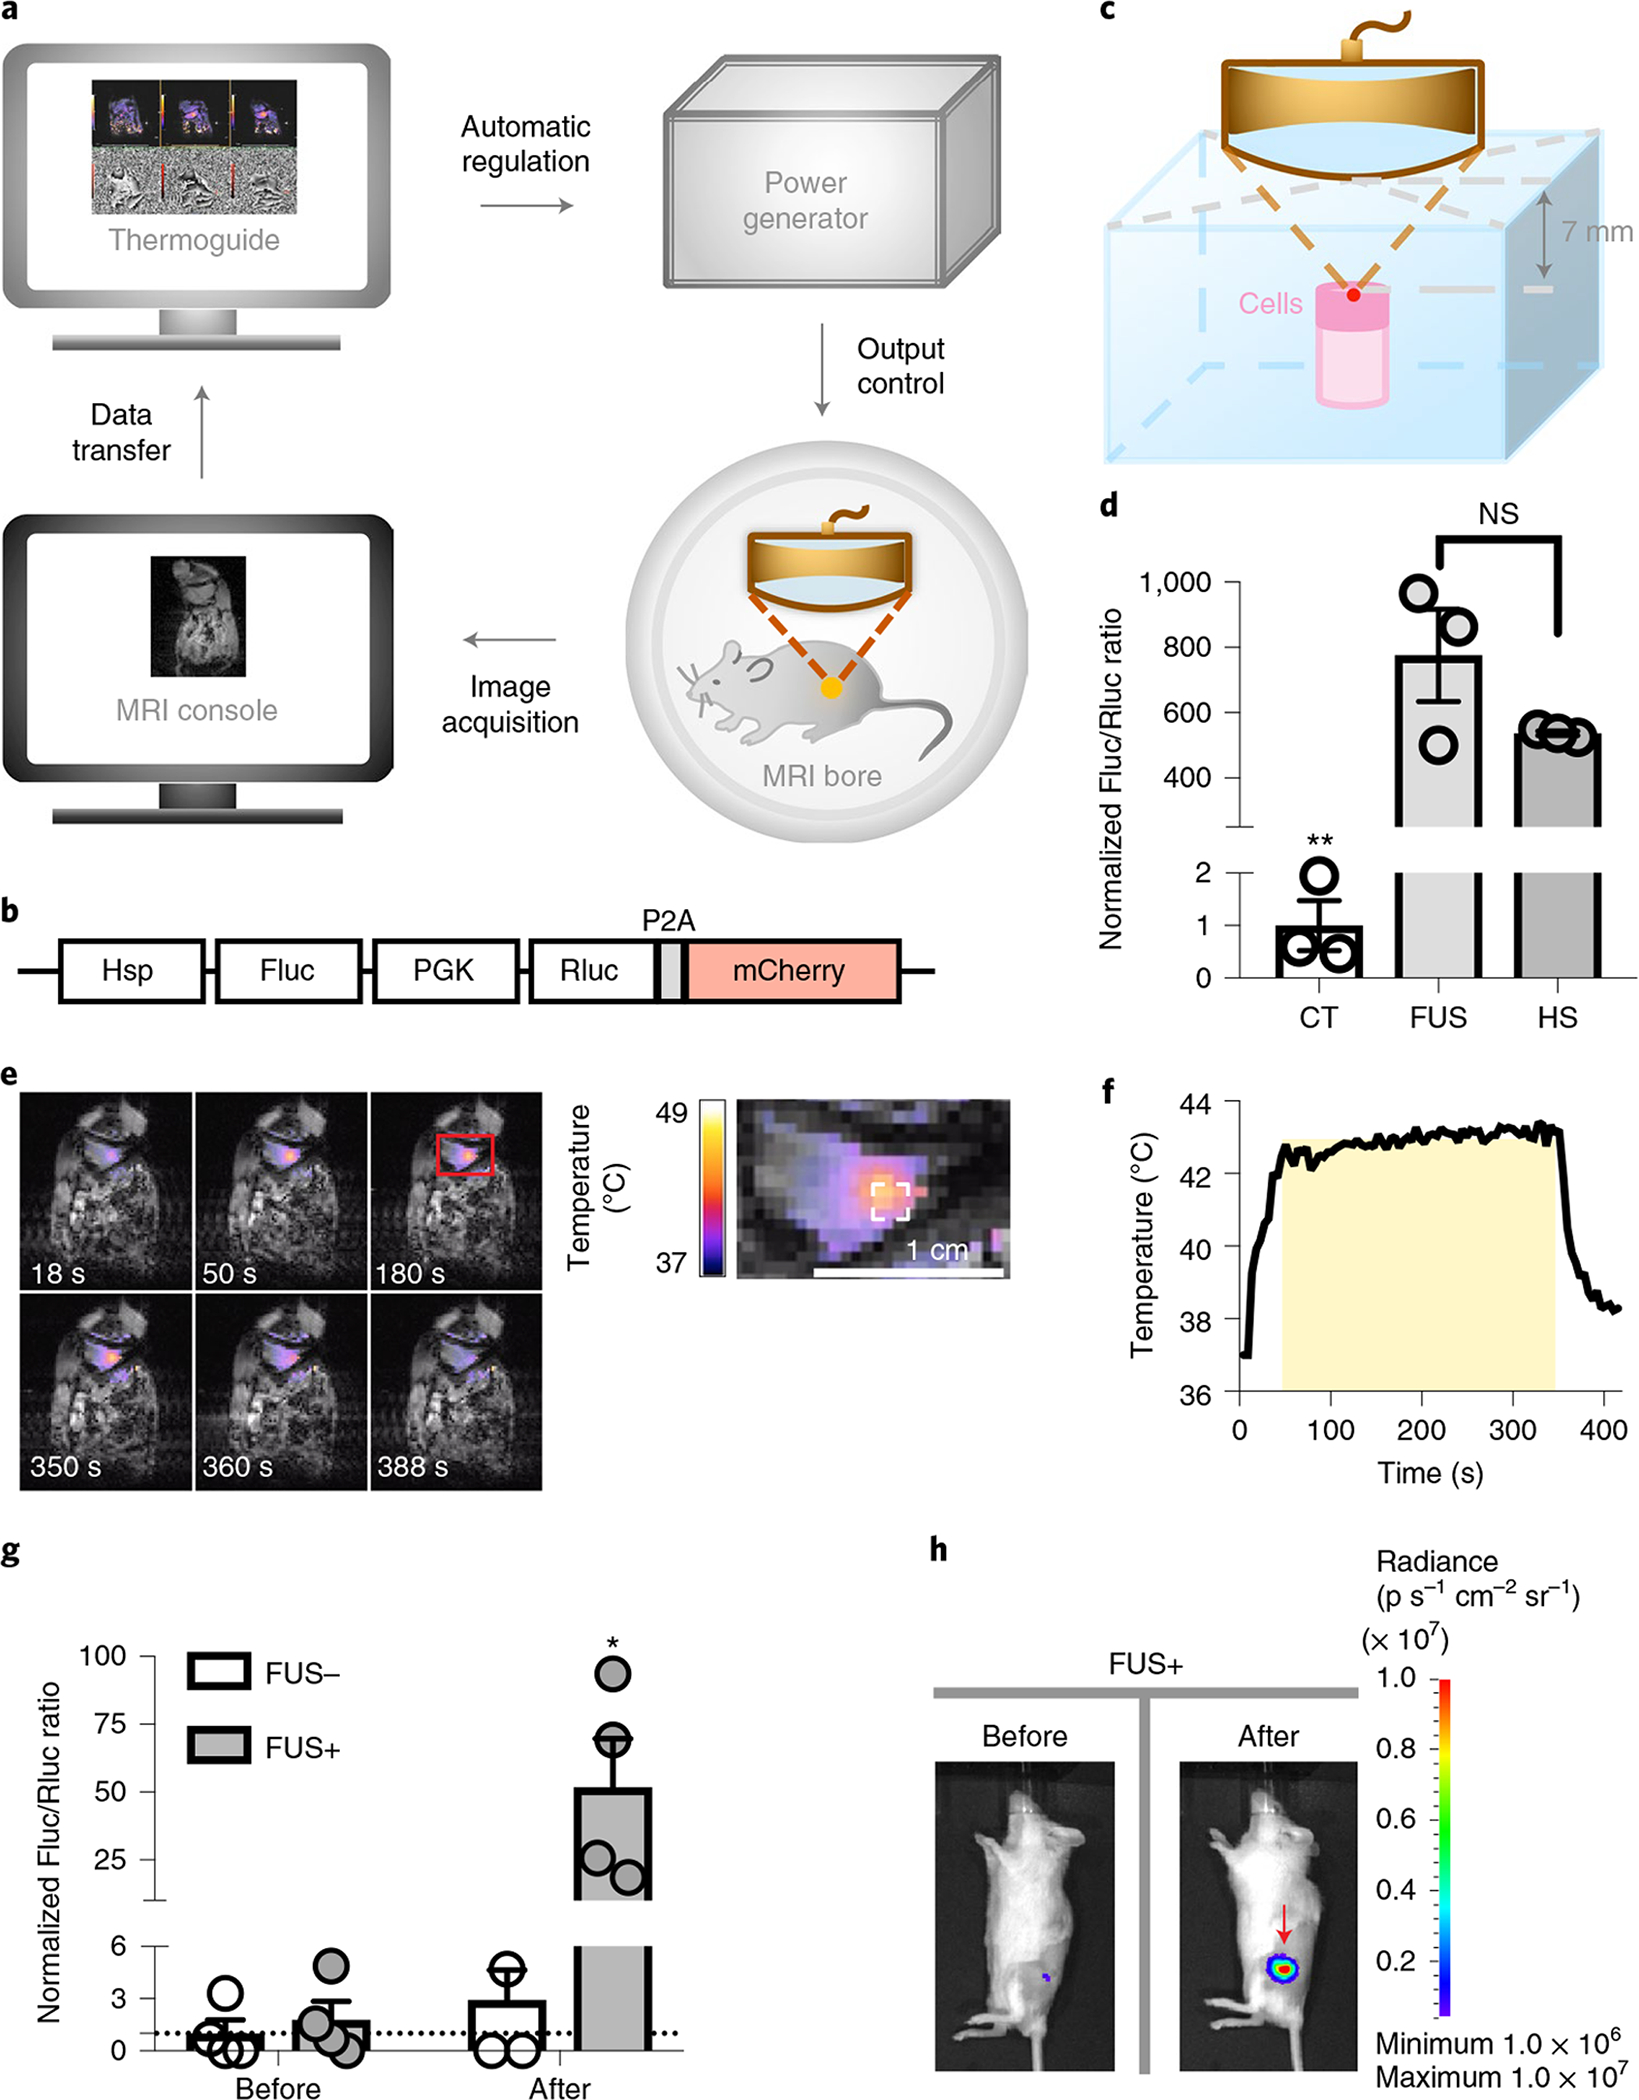
Fig. 3 |. MRI-guided FUS-inducible gene activation in phantom and in vivo.

a, Schematics of the MRI-guided FUS system. b, Schematics of the dual-luciferase reporter. P2A, 2A self-cleaving peptide derived from porcine teschovirus-1. c, Experimental setup of FUS stimulation on cells in a tofu phantom. d, Gene induction level in Nalm-6 cells containing the dual-luciferase reporter with three pulses of 5 min heating by MRI-guided FUS in tofu phantom (FUS) or by thermal cycler (HS). Gene induction level was quantified by the Fluc/Rluc ratio and normalized to CT. **P = 0.0013 between CT and FUS; **P = 8.4 × 10⁻³ between CT and HS; NS, no significant difference, P = 0.1767. One-way ANOVA followed by Tukey’s multiple comparisons test. N = 3 biological replicates. e, Left: colour-coded temperature map superimposed on MRI images at different time points during a 5 min FUS stimulation at 43 °C on the hindlimb of an anaesthetised mouse. Right: close-up of the red rectangle region on the left. The dashed white square outlines the region of interest for temperature regulation. f, The average temperature of the region of interest during FUS stimulation in e. The yellow shadow represents the predefined target temperature (43 °C) and duration (300 s) of FUS stimulation. g, Gene induction in vivo by MRI-guided FUS on Nalm-6 cells with the dual-luciferase reporter. FUS+ or FUS−, with or without two pulses of 5 min FUS stimulation at 43 °C. Gene induction was quantified by the in vivo Fluc/Rluc ratio and normalized to the ‘FUS−, Before’ group, as indicated by the dotted line (y = 1). *P = 1.09 × 10⁻² between ‘FUS+, After’ and ‘FUS−, After’; **P = 9.3 × 10⁻³ between ‘FUS+, After’ and ‘FUS+, Before’. Two-way ANOVA followed by Sidak’s multiple comparisons test. N = 4 mice. h, Representative BLI images of Fluc expression before and after FUS stimulation in g. Bar heights and error bars represent mean ± s.e.m.
