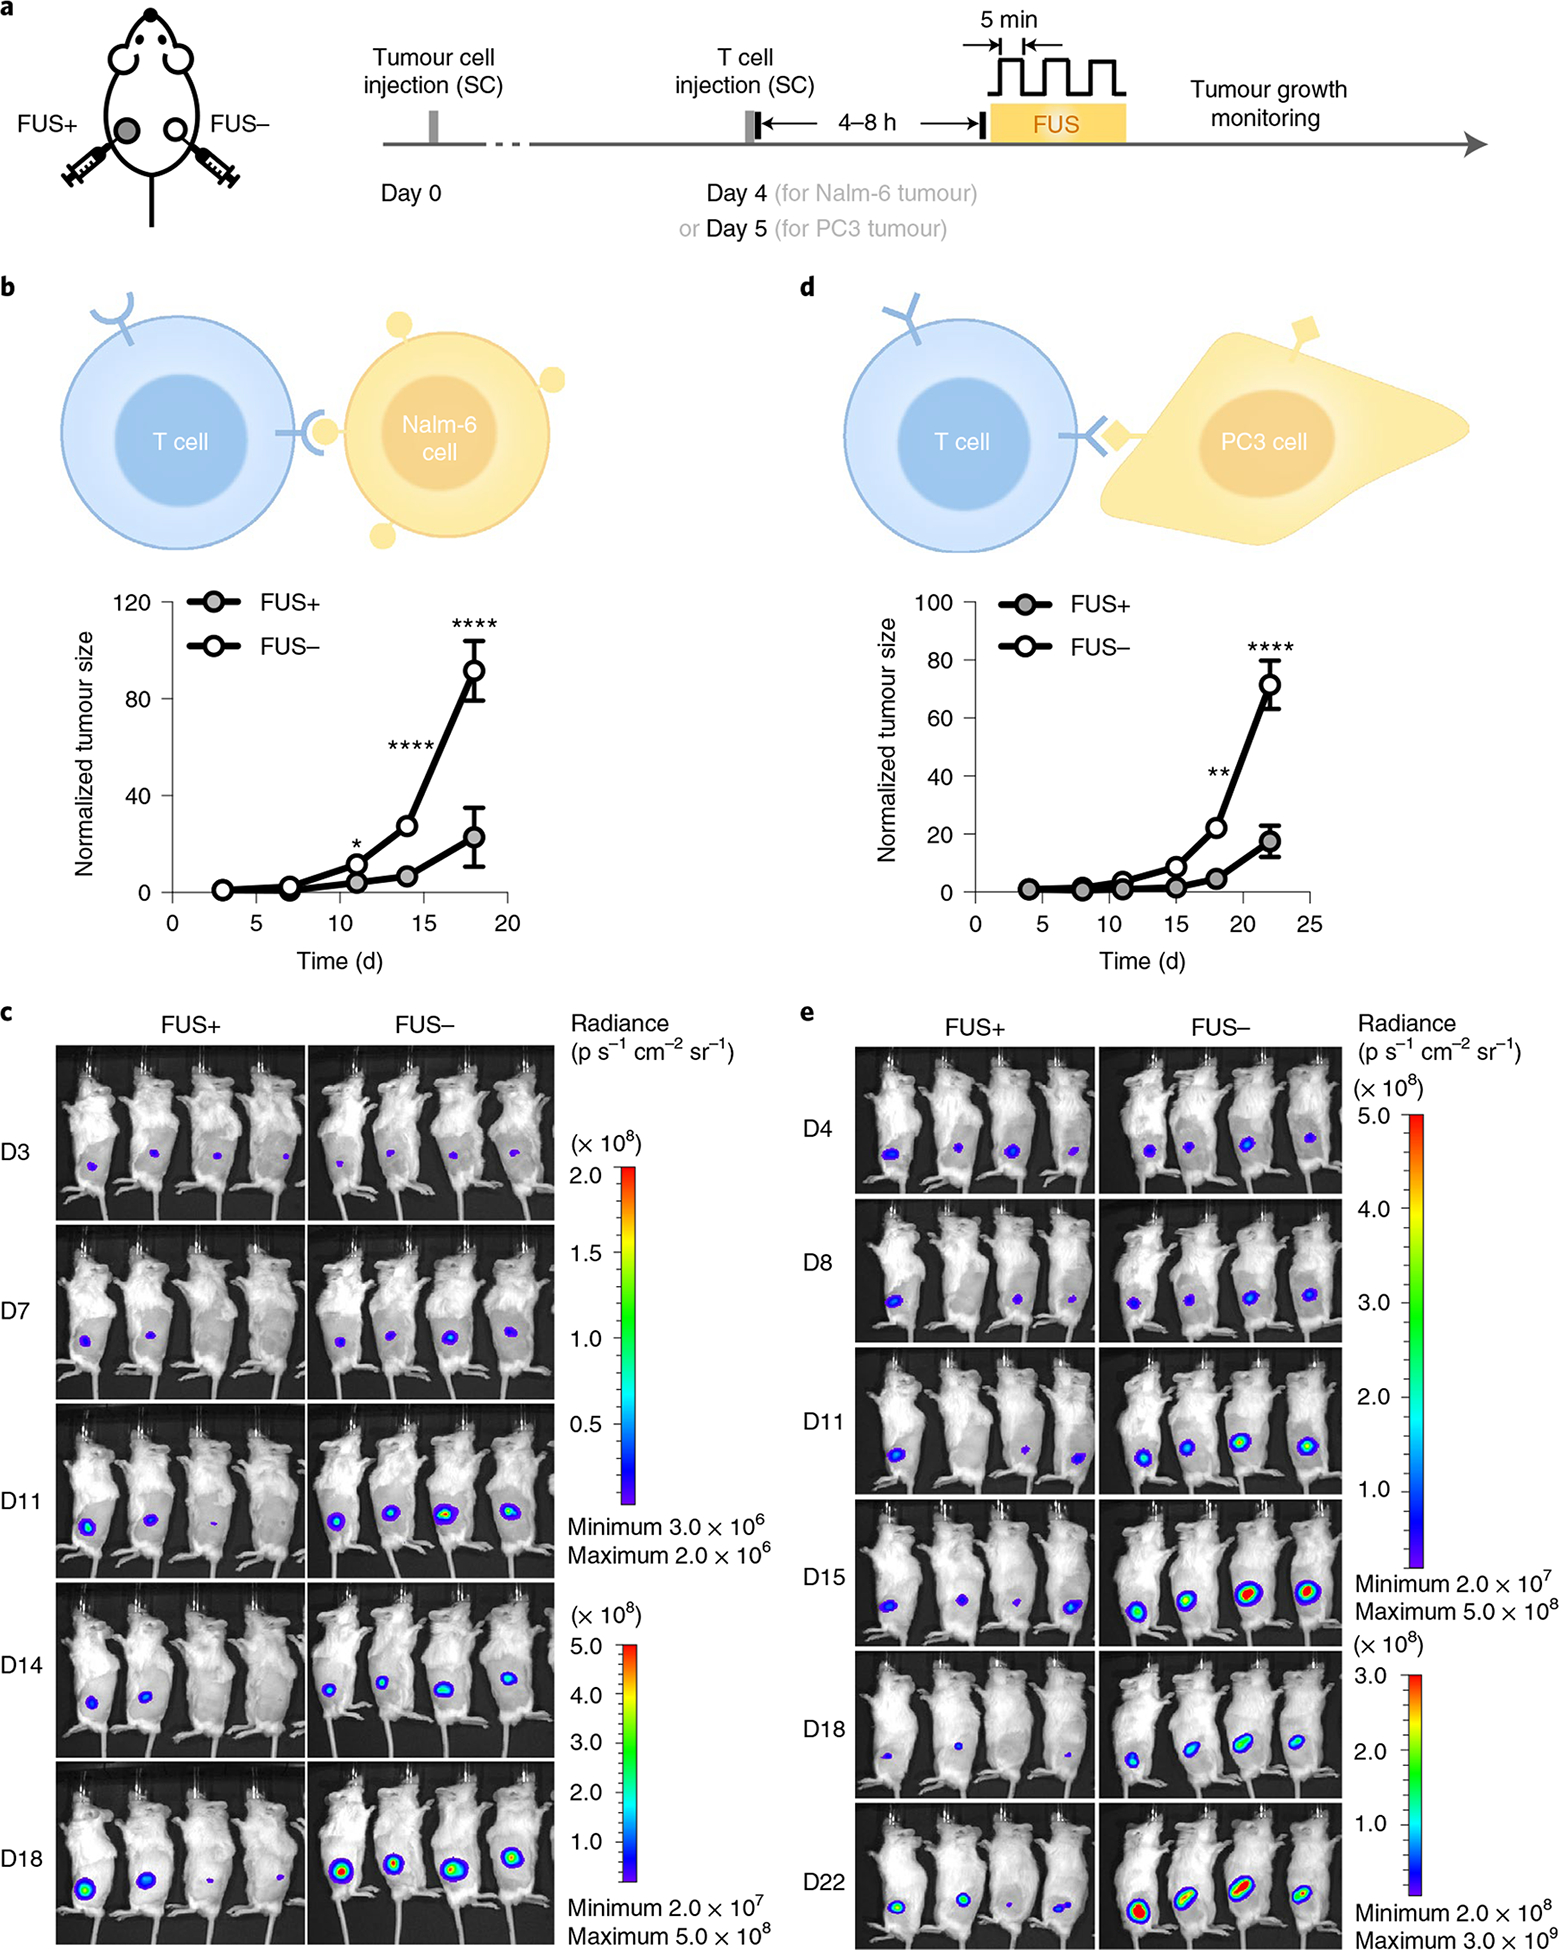
Fig. 4 |. Tumour suppression by FUS-CAR-T cells in vivo.

a, Timeline of in vivo experiment using NSG mice bearing matched bilateral tumours. Both tumours received local subcutaneous (SC) injection of engineered CAR-T cells. The tumour on the left received FUS stimulation (FUS+) and the one on the right received no FUS (FUS−). b–e, Normalized tumour sizes (b,d) and representative BLI images (c,e) of Nalm-6 tumours (b,c) and PC3 tumours (d,e). Tumour size was quantified using the integrated Fluc luminescence intensity of the tumour region and normalized to that of the same tumour on the first measurement. In b, *P = 2.7 × 10⁻² at day 11 (D11), ****P = 4.52 × 10⁻⁶ at D14, ****P = 5.12 × 10⁻¹² at D18. In d, **P = 2.6 × 10⁻³ at D18, ****P = 3.5 × 10⁻⁹ at D22. Two-way ANOVA followed by Sidak’s multiple comparisons test. Data points and error bars represent means of four mice ± s.e.m.
