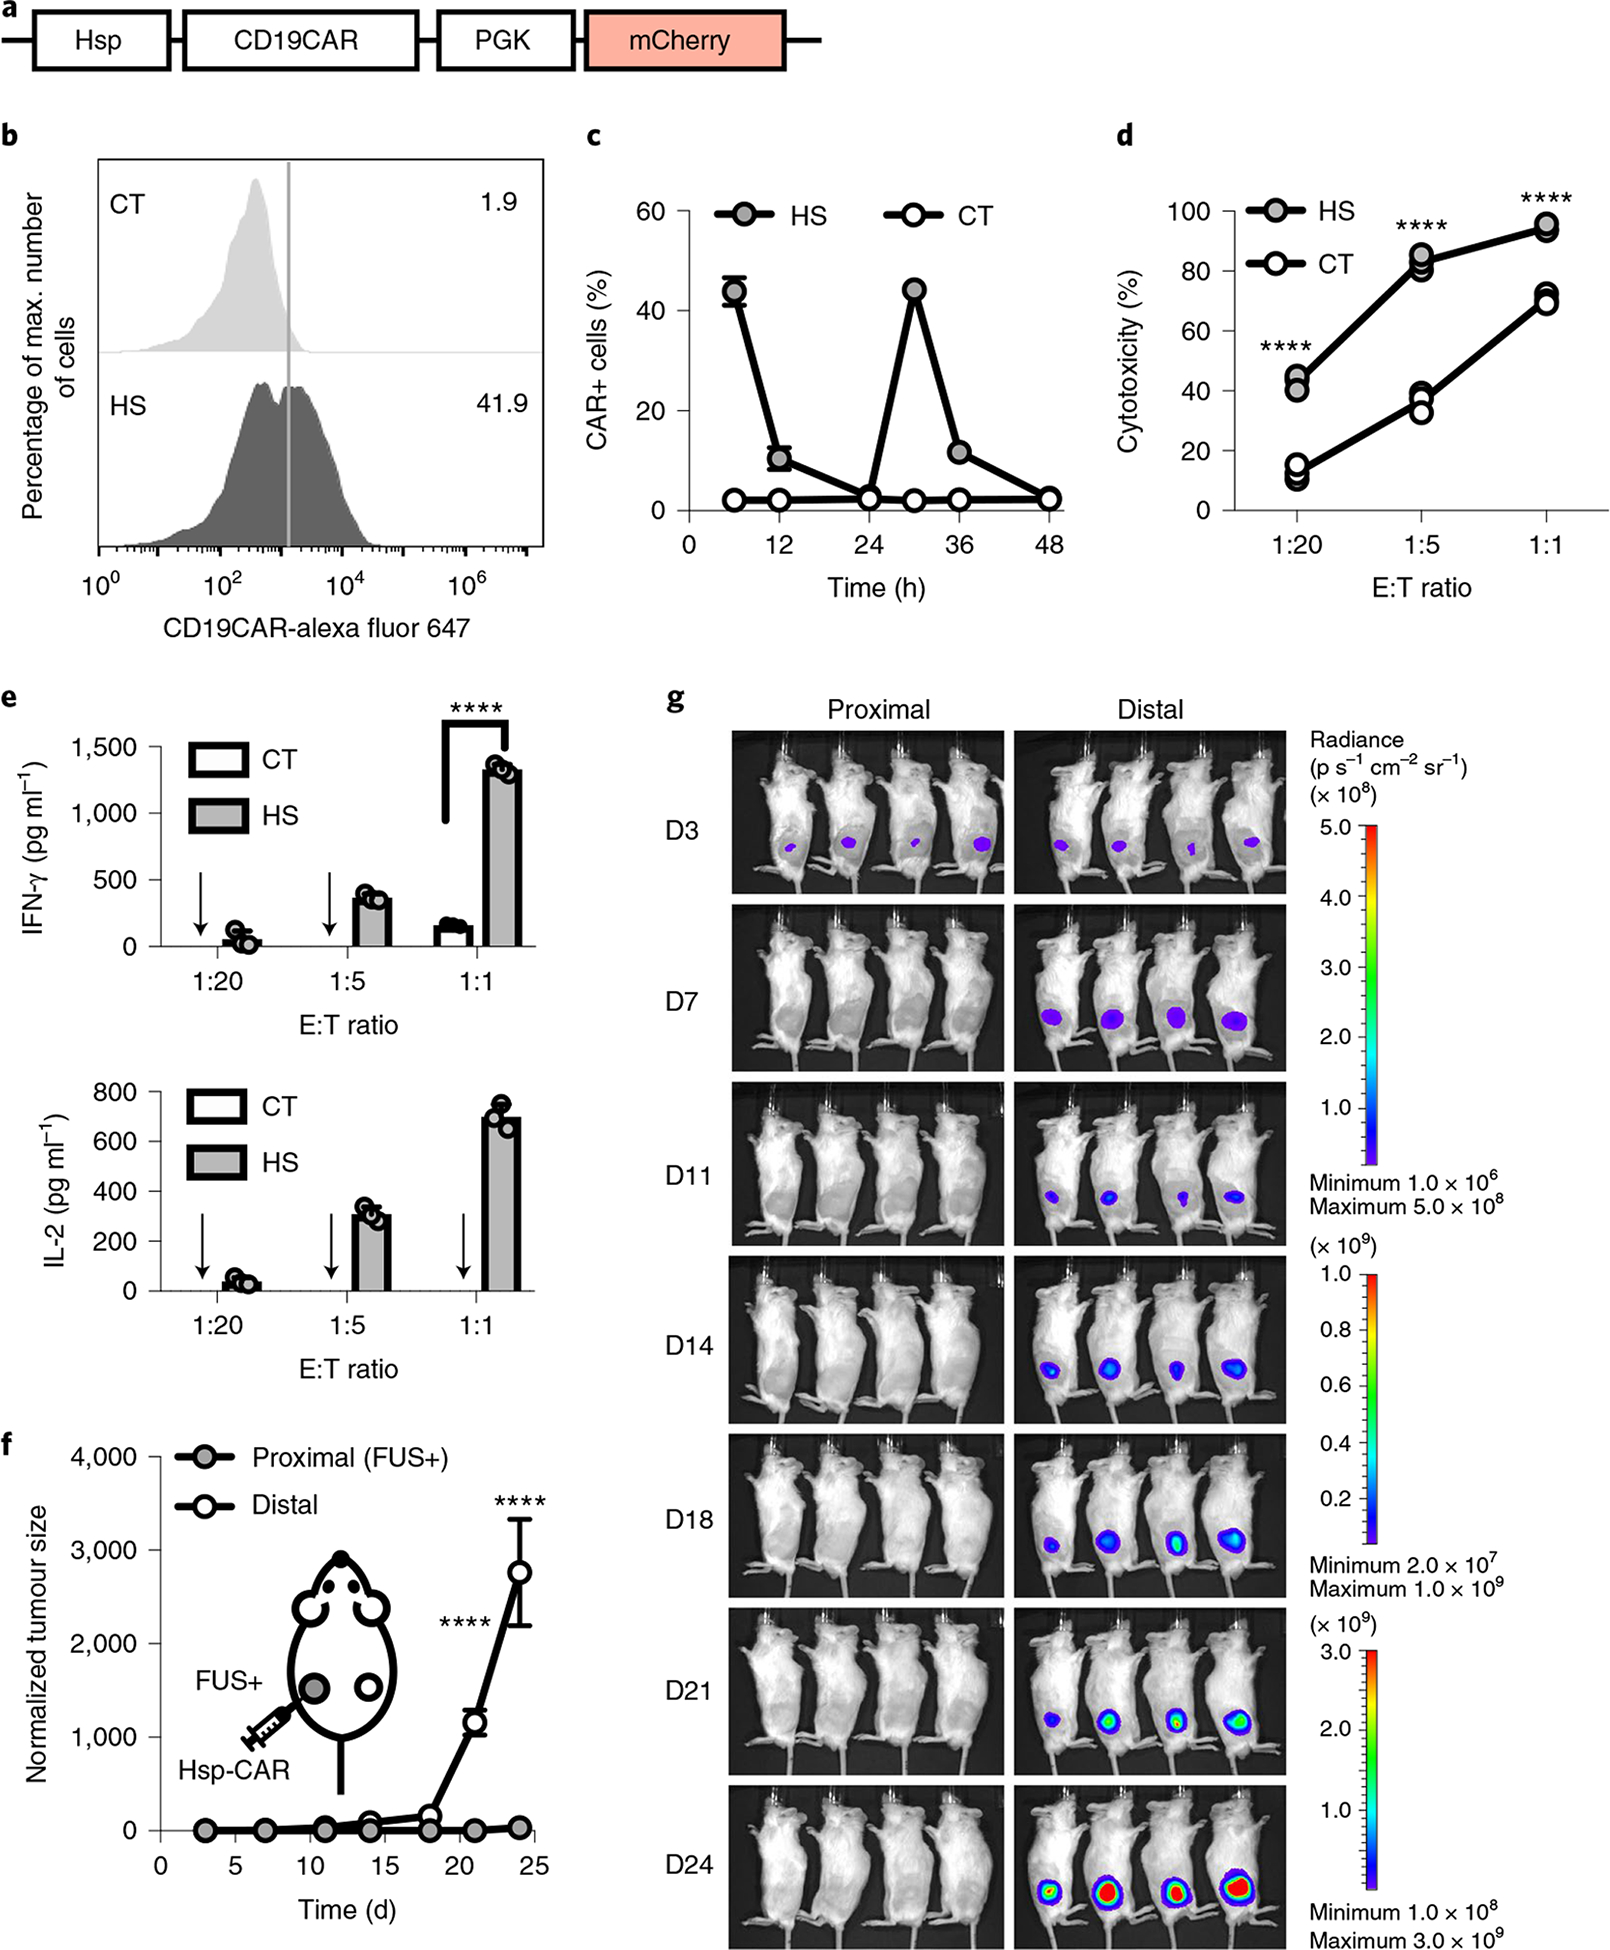
Fig. 6 |. Reversible FUS-CAR-T cells.

a, Schematics of the Hsp-CD19CAR transgene. b, Representative flow cytometry data of CAR expression profile 6 h after HS. c, Dynamics of CAR expression in cells with repeated HS stimulation at 0 h and 24 h. d,e, Cytotoxicities of the engineered T cells against Nalm-6 cells at different E:T ratios (left to right: ****P = 7.9 × 10⁻⁹, ****P = 5.2 × 10⁻¹¹, ****P = 1.1 × 10⁻⁷) (d) and the associated IFN-γ (****P = 2.8 × 10⁻¹⁴) and IL-2 cytokine secretion (e). Arrow, cytokine level not detectable. N = 3 biological replicates. f,g, Normalized tumour size (f) and BLI images (g) of bilateral tumour-bearing mice with local administration of reversible FUS-CAR-T cells followed by FUS stimulation at the proximal tumour on D4 and D7. Tumour size was quantified using the integrated Fluc luminescence intensity of the tumour region and normalized to that of the same tumour on the first measurement. In f, ****P = 3.6 × 10⁻⁵ at D21, ****P = 9.0 × 10⁻¹⁵ at D24. N = 4 mice. Two-way ANOVA followed by Sidak’s multiple comparisons test. Data points in c and f and bar heights in e represent means. Error bars represent s.e.m.
