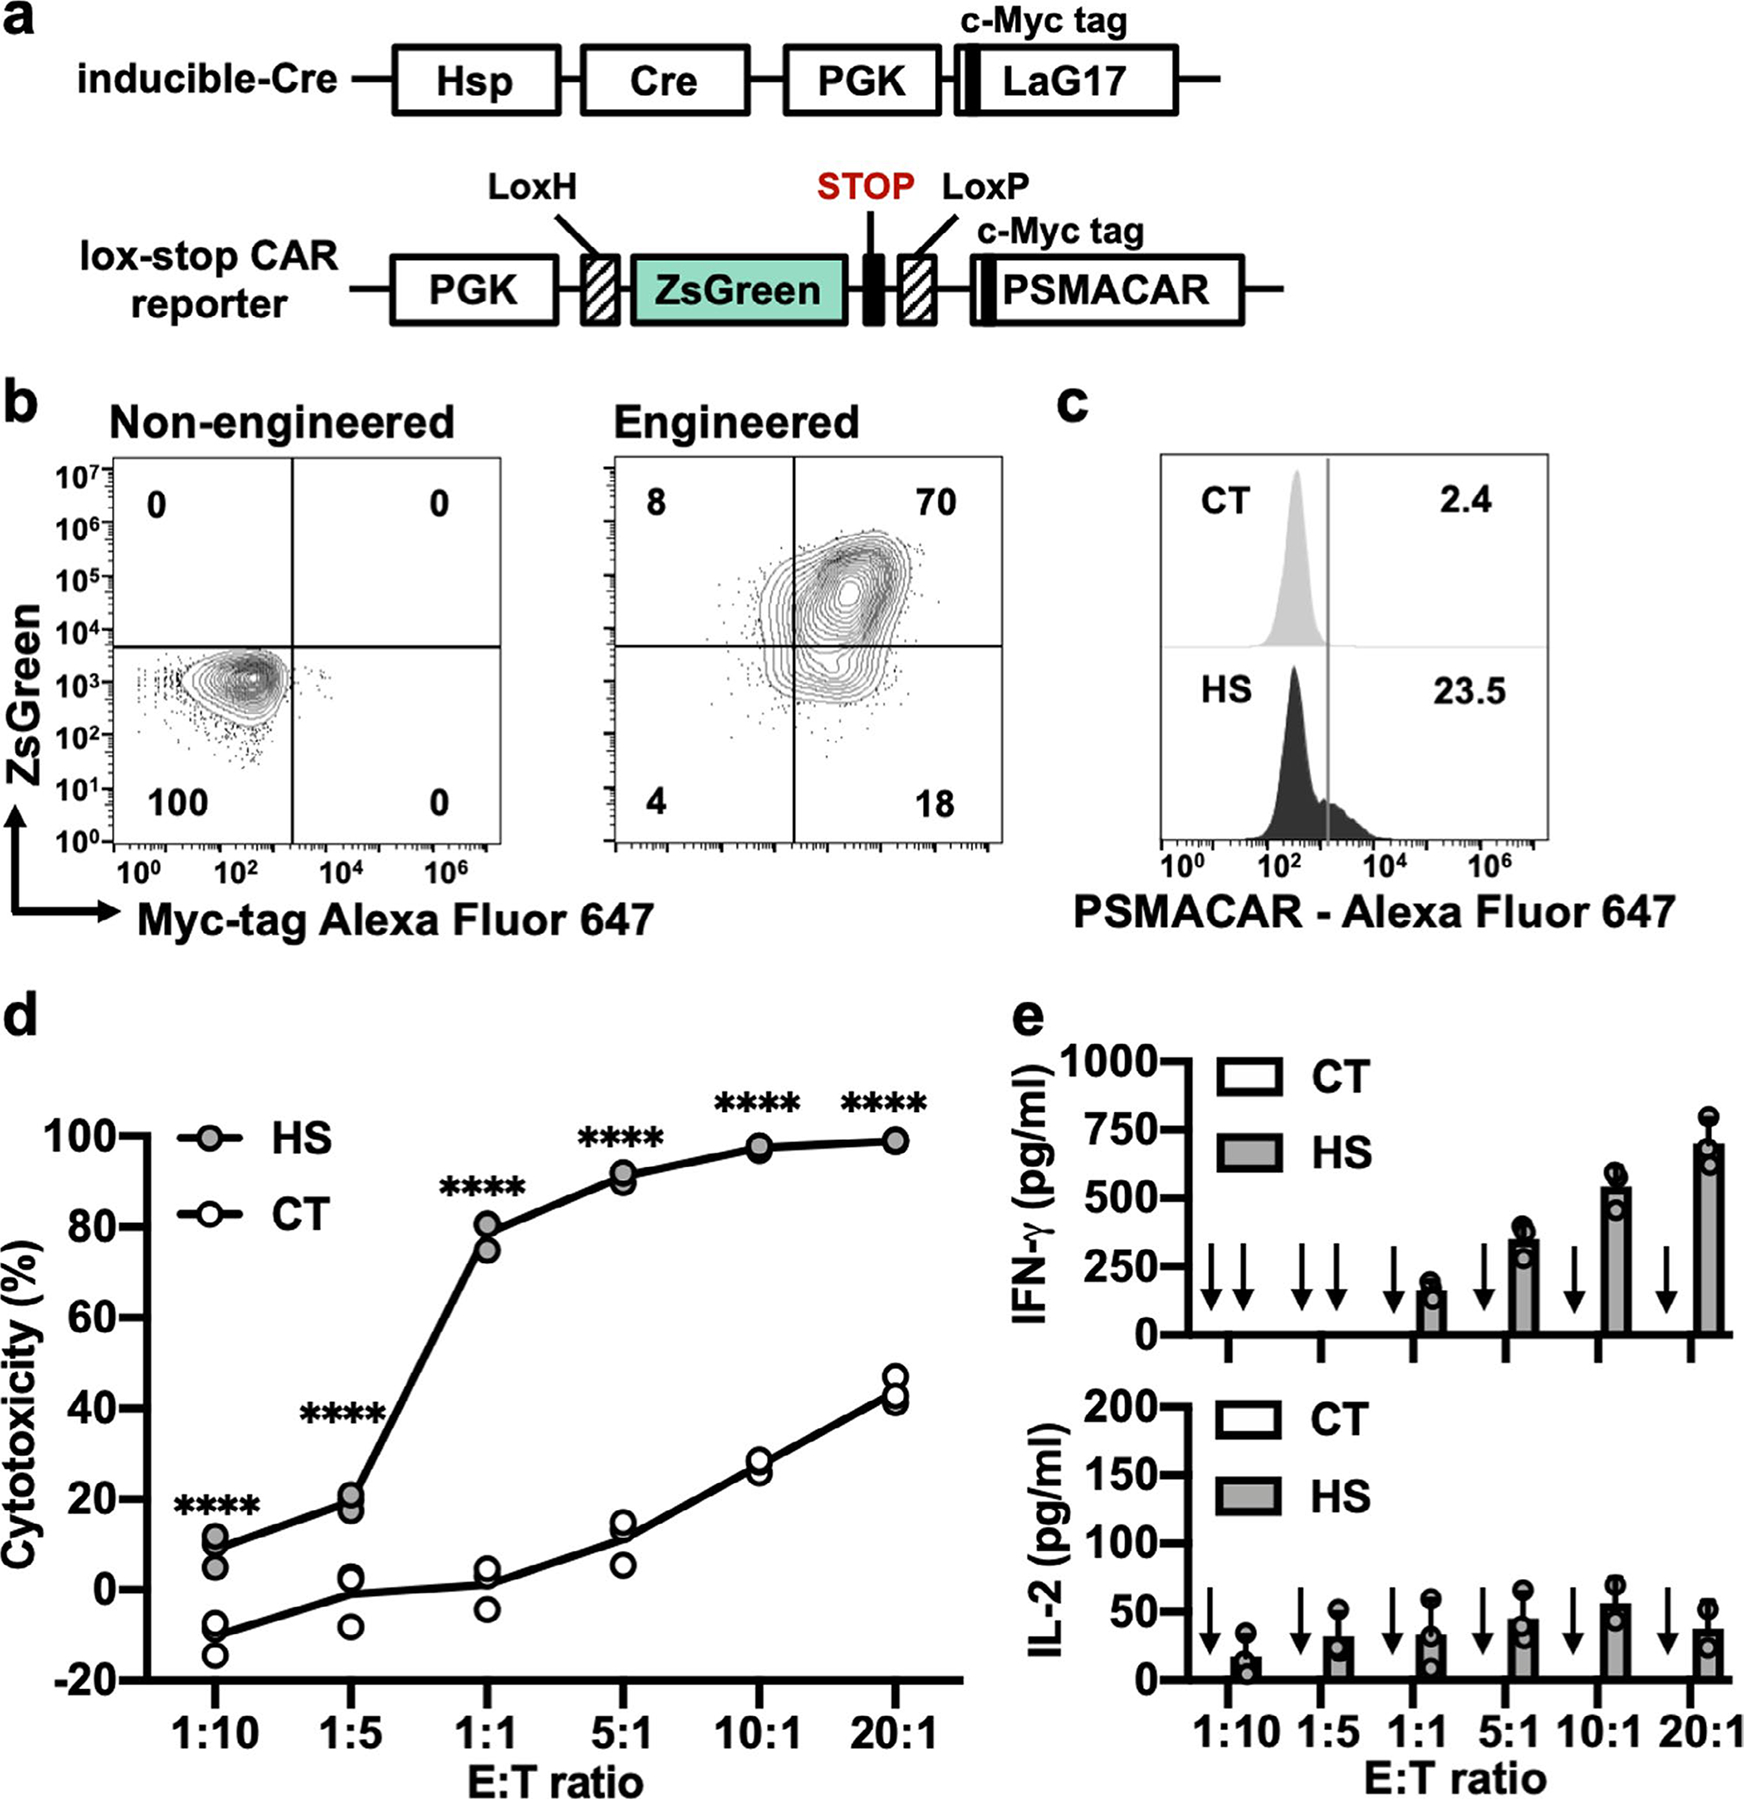
Extended Data Fig. 2 |. Functionality of FUS-inducible PSMACAR T cells in vitro.

a, Schematics of transgenes: heat-inducible Cre and lox-stop PSMACAR reporter. b, Representative flow cytometry data of the percentage of double positive T cells after MACS. c, Representative PSMACAR induction by HS. d, Cytotoxicities of the T cells engineered with the transgenes in a against Fluc+ PSMA + PC3 tumour cells at various E:T ratios. From left to right: ****P = 3.09 × 10⁻⁶, P = 1.11 × 10⁻⁶, P < 1 × 10⁻¹⁵, P < 1 × 10⁻¹⁵, P < 1 × 10⁻¹⁵, P = 3 × 10⁻¹⁵. e, Quantification of IFN-γ and IL-2 cytokine release associated with d. Arrow: cytokine level not detectable. In c to e, CT: without HS. HS: with a continuous 15-min HS. Two-way ANOVA followed by Sidak’s multiple comparisons test. Bar heights and error bars represent means of 3 biological replicate ± SEM.
