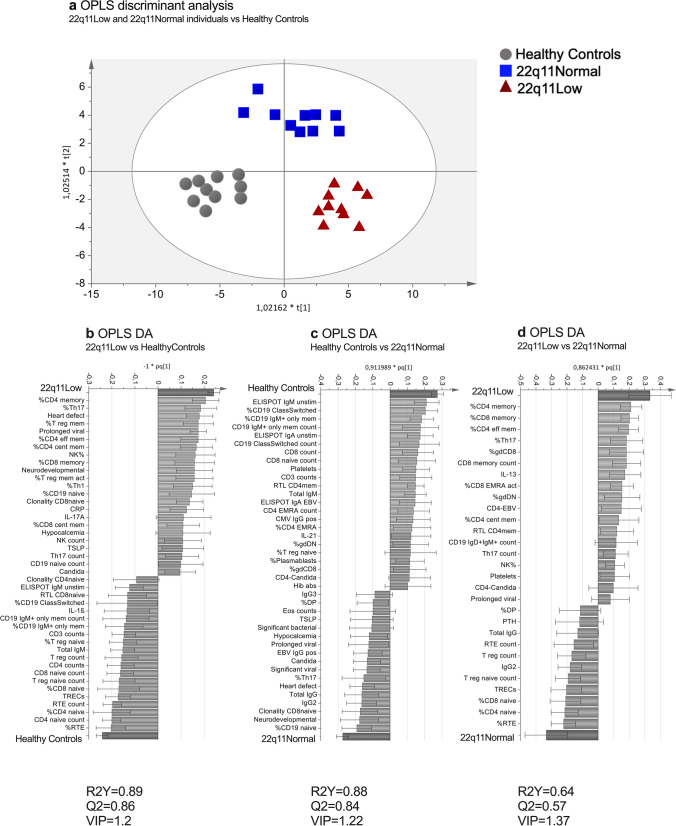
Fig. 4.
Multivariate discriminant analysis (DA) based on the immunological data and clinical data at follow-up. a OPLS-DA score plot showing healthy controls (gray dots), 22q11Normal (blue squares), and 22q11Low (red triangles) individuals, respectively. OPLS-DA column loading plots depicting the associations between the X-variables and the following groups: 22q11Low and healthy controls (b); 22q11Normal and healthy controls (c); and 22q11Low and 22q11Normal (d). The X-variables represented by a bar (light grey) pointing in the same direction as a group (dark grey bar) are positively associated with that group, whereas variables pointing in the opposite direction are inversely related. The larger the bar and the smaller the error bar, the stronger is that variable´s contribution to the model. All variables included in the model are listed in Supplementary Table S3. Only the X-variables with the strongest contributions to the model are shown and variable influence on projection (VIP) thresholds are indicated.

