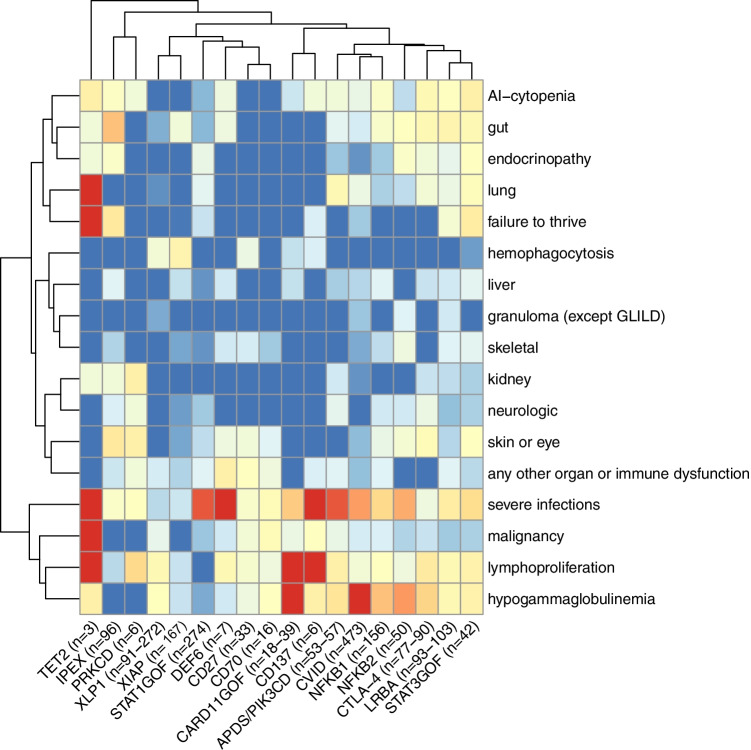
Fig. 3.
‘Phenotype expression array’ showing results of unsupervised hierarchical clustering of 18 IEI with immune dysregulation according to the IDDA2.1 parameter list. The same patient cohorts were analyzed as shown and referenced in Fig. 2. The clustered heatmap was created by using the R package pheatmap 1.0.12 (Raivo Kolde, 2019). The hierarchical clustering was the result of complete linkage based on Euclidean distances (after logistic transformation truncated at 1%). Red boxes indicate high frequency, blue boxes low frequency. “Pedigrees” indicate the calculated similarities or distances; not taking into account the relative frequency of patients evaluated in the original data collection (see numbers next to the IEI diagnosis). Therefore, due to very low patient numbers (< 10), phenotype data for DEF6, PRKCD, CD137, and TET2 deficiencies are less reliable than those for other IEI with higher patient numbers

