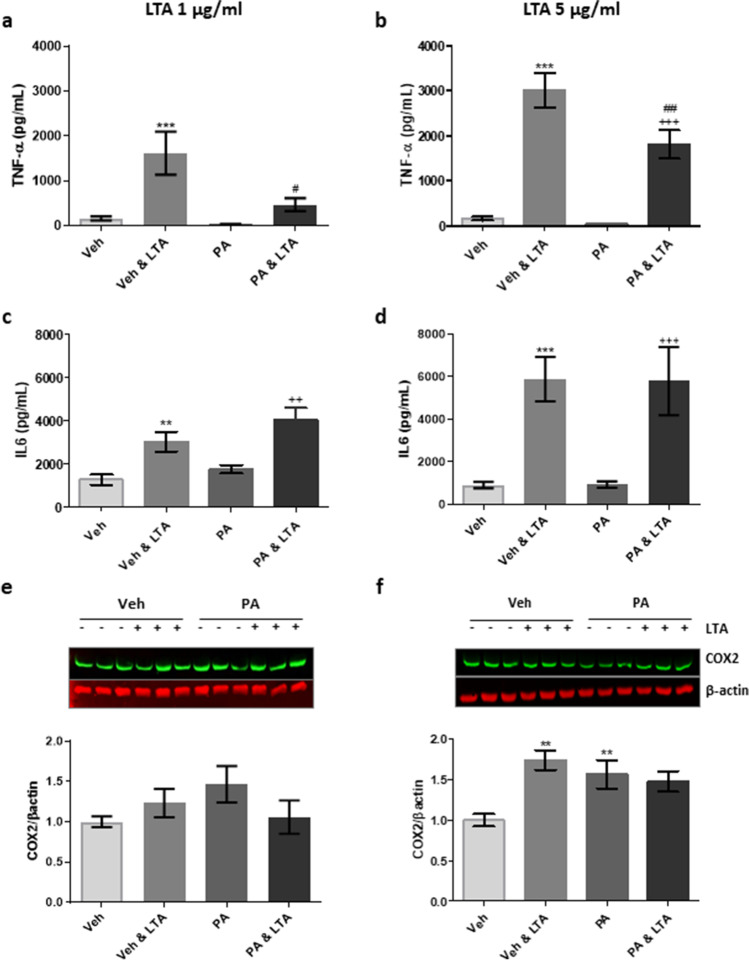
Fig. 1.
Palmitic acid attenuates LTA-induced TNF-α release from microglia. BV2 cells were exposed to palmitic acid (PA; 100 μM) or vehicle control (Veh) for 24 h, and stimulated with LTA (1 or 5 μg/mL) during the final 4 h. Supernatant concentrations of TNF-α (a, b) and IL-6 (c, d) were assessed using ELISA (n = 9–24 replicates). Western immunoblot was used to determine the expression of COX2 in cell lysates (e, f), relative to the expression of β-actin (n = 9–14 replicates from 3–6 independent experiments). Data is presented as mean ± SEM. **p < 0.01, ***p < 0.0001, compared to Veh; ++p < 0.01, +++p < 0.0001, compared with PA; #p < 0.05, ##p < 0.01, compared with Veh + LTA; two-way ANOVA followed by Bonferroni and Newman-Keuls analysis. Inserts illustrate representative immunoreactive bands for COX2 and β-actin (triplicate samples)

