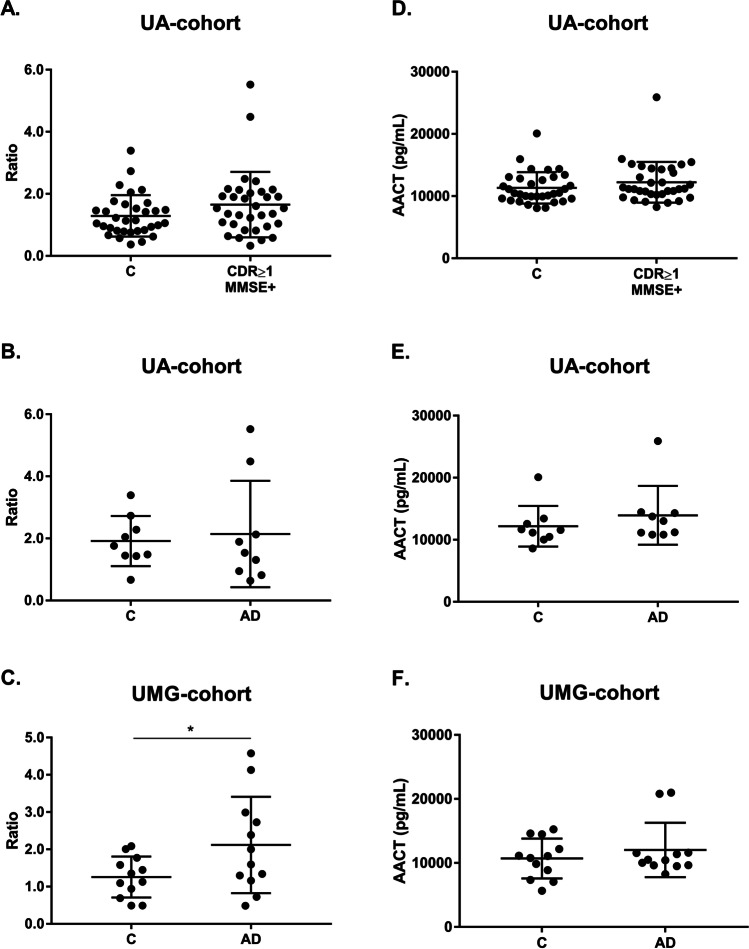
Fig. 7.
AACT exosomal levels in dementia and AD cases monitored by distinct antibody-based approaches. AACT levels were assessed through immunoblot analysis or commercial ELISA assays in serum-derived exosomes from Controls (CDR = 0 and MMSE −) and individuals with dementia (CDR ≥ 1 and MMSE +) from UA-cohort (a, d), and AD clinically diagnosed cases from UA-cohort (b, e) or UMG-cohort (c, f). For WB, each point represents the relative densitometry ratio. For ELISA, each point represents the mean concentration value obtained for each individual. The solid horizontal line shows mean, and error bars indicates standard deviations. Abbreviations: AD, Alzheimer’s disease; C, Controls; CDR, Clinical Dementia Rate; MMSE, Mini-Mental State Examination. *p ≤ 0.05

