Fig. 4.
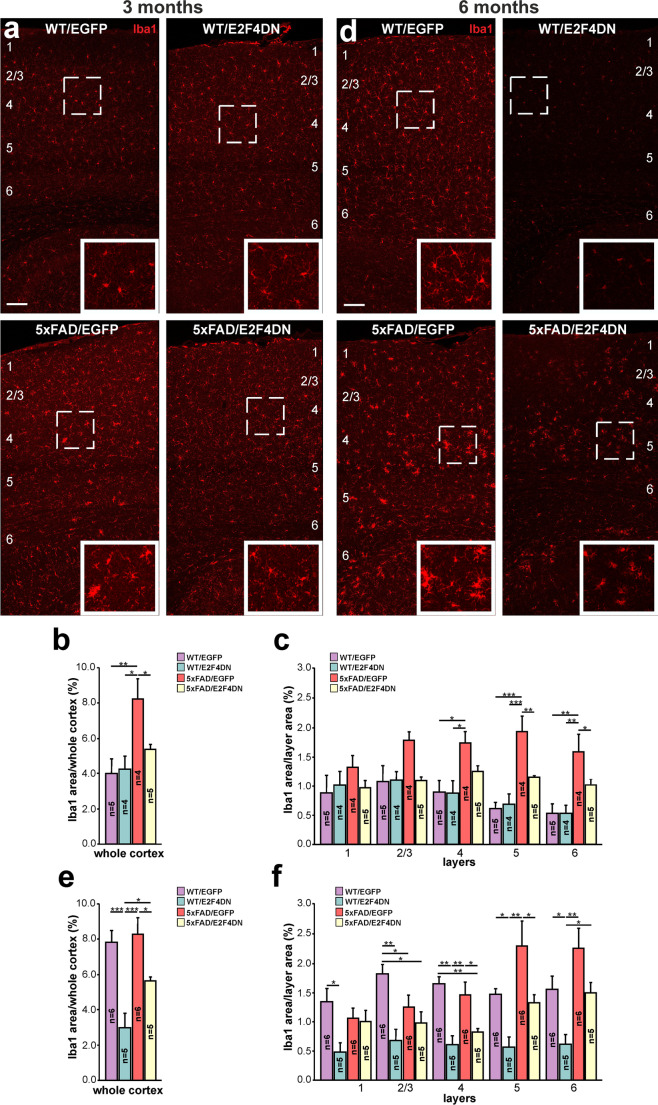
Modulation of microgliosis by E2F4DN in the cerebral cortex of 5xFAD mice. a Iba1 immunostaining in the cerebral cortex of mice of the indicated genotypes at 3 months (m) or 6 m. b Percentage of the area occupied by Iba1 immunostaining in the cerebral cortex of mice of the indicated genotypes at 3 m. c Percentages of the area occupied by Iba1 immunostaining in the indicated cortical layers at 3 m. d Iba1 immunostaining in the cerebral cortex of mice of the indicated genotypes at 6 m. Notice the decrease of Iba1-positive labeling in the cerebral cortex of 6 month-old WT mice expressing neuronal E2F4DN. e Percentage of the area occupied by Iba1 immunostaining in the cerebral cortex of mice of the indicated genotypes at 6 m. f Percentages of the area occupied by Iba1 immunostaining in the indicated cortical layers at 6 m. Numbers in a and d refer to the different cortical layers. Inserts in a and d show high magnifications of the indicated dashed boxes. *p < 0.05; **p < 0.01; ***p < 0.001 (one-way ANOVA followed by post hoc Newman-Keuls test). 3 months: WT/EGFP (1 male and 4 females), WT/E2F4DN (3 males and 1 female), 5xFAD/EGFP (3 males and 1 female), and 5xFAD/E2F4DN (4 males and 1 female). 6 months: WT/EGFP (4 males and 2 females), WT/E2F4DN (3 males and 2 females), 5xFAD/EGFP (3 males and 3 females), and 5xFAD/E2F4DN (5 males). Scale bar: 100 μm

