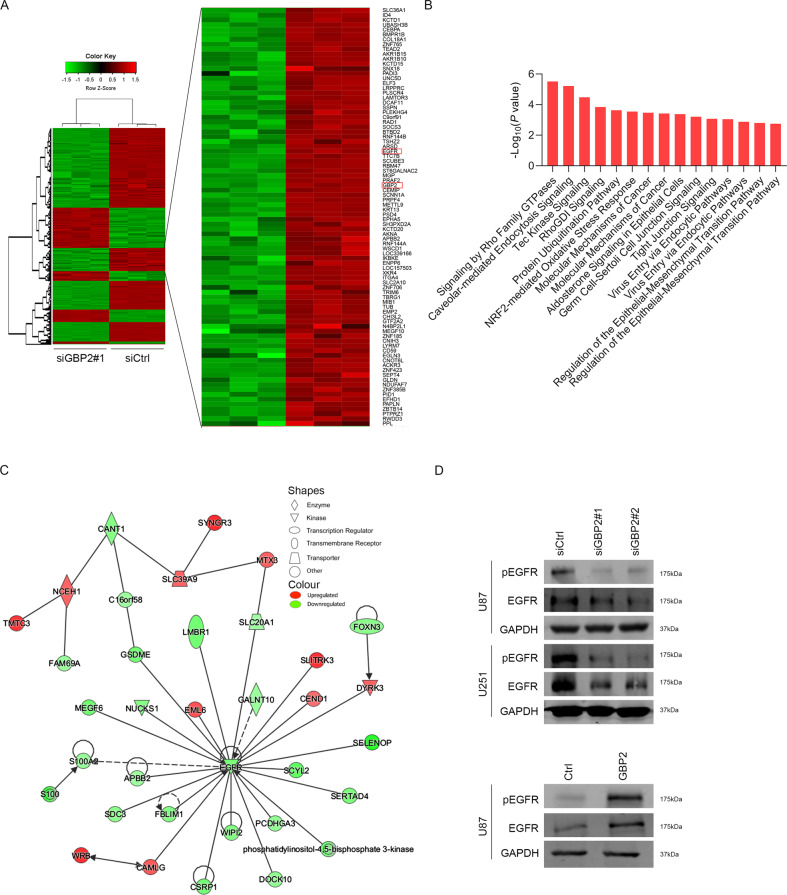
Fig. 4. GBP2 regulates EGFR signaling pathway.
A Heat map showing distinct level of mRNAs in control and siGBP2 cells. In the clustering analysis, red indicates upregulated genes, green indicates downregulated genes, and gray dots represent genes showing no change in expression. B The pathway enrichment analysis using IPA analysis with GBP2 knockdown according to microarray datasets. C IPA analysis of biological protein interactions with GBP2 involved in EGFR signaling pathway according to microarray datasets. D Western blotting results showing changes in protein levels in the EGFR signaling pathway. U87 cells with GBP2 overexpression or depletion are analyzed.

