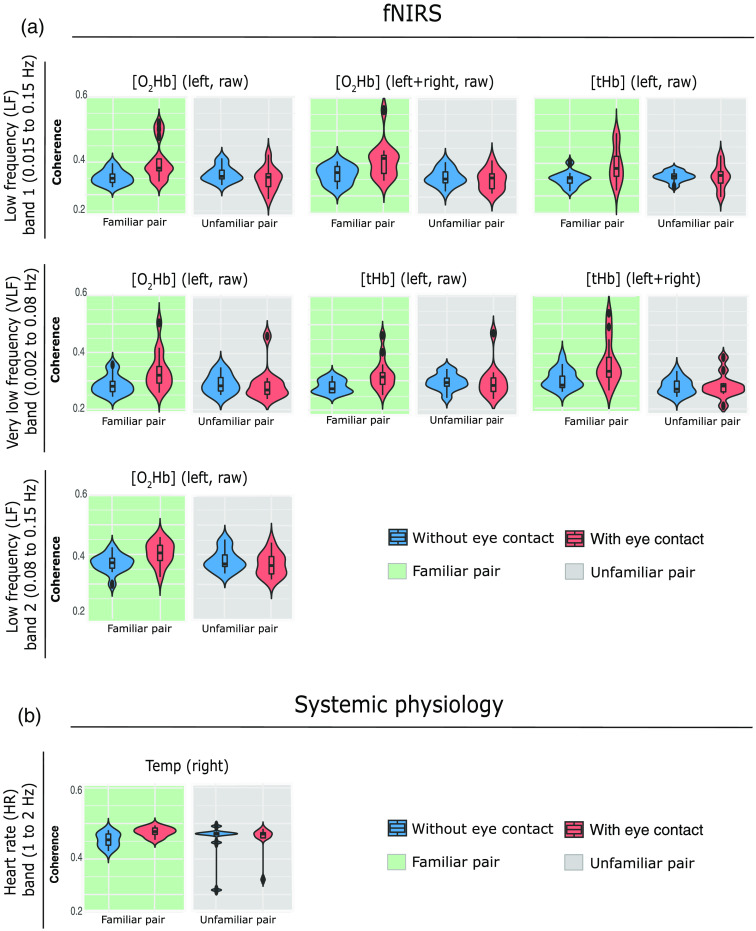
Fig. 11.
Violin plots of the WTC values distributions over the two groups (familiar and unfamiliar pair) grouped into fNIRS and systemic physiology signals and separated into (a) LF1 and VLF bands and (b) LF2 and HR bands. In the above figures are reported only the significant differences as a result of the aligned ranks transformation ANOVA.

