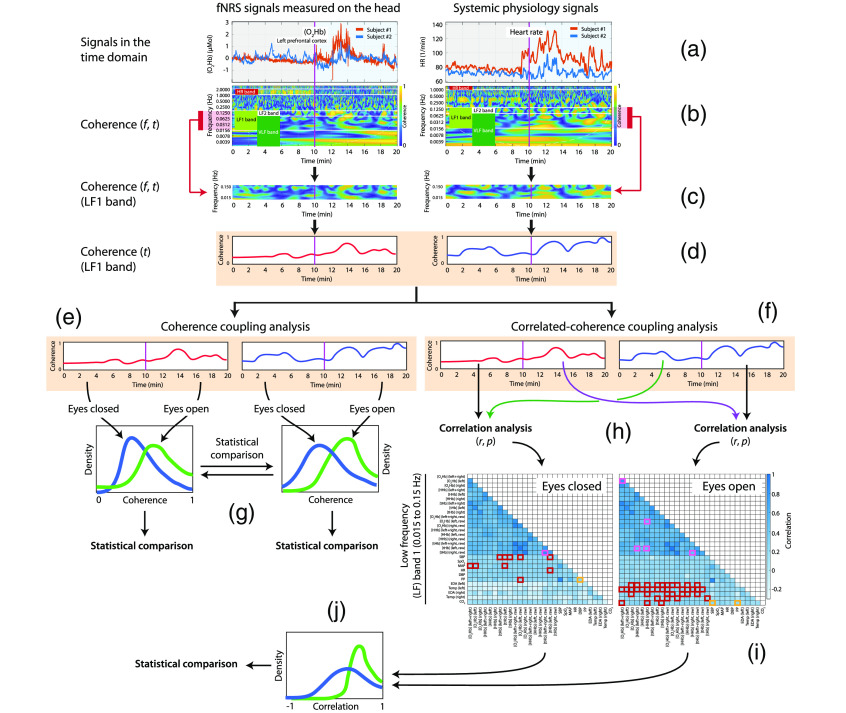
Fig. 3.
Visualization of the signal processing and data analysis steps of the coherence and correlated-coherence coupling analysis. The figure shows the steps performed in the analysis for a given dyad taking as an example, a pair of fNIRS signals ( (left)) and the HR of the two participants (a) considering only the LF1 band. (b) The wavelet coherence analysis of the two pairs of time series is performed and the respective scalograms are shown with the four frequency bands. (c) One frequency band is selected and (d) the median of the coherence values is calculated, leading to two time-dependent WTC signals. (e) In the coherence coupling analysis, the time-dependent coherence of the fNIRS and systemic physiology signals have been averaged over the two conditions. (g) The ART ANOVA was then performed on the resulting coherence values to assess any difference between the eyes-closed and eye-contact conditions. (f) In the correlated-coherence coupling analysis, the time-dependent coherence signals are split according to the two conditions and (h) Spearman correlation and its significance levels are calculated, (i) leading to a correlation matrix of the correlation coefficients from all types of time series. (j) Finally, the correlation distribution of each type of time series over the two conditions was tested with Kolmogorov–Smirnov test.

