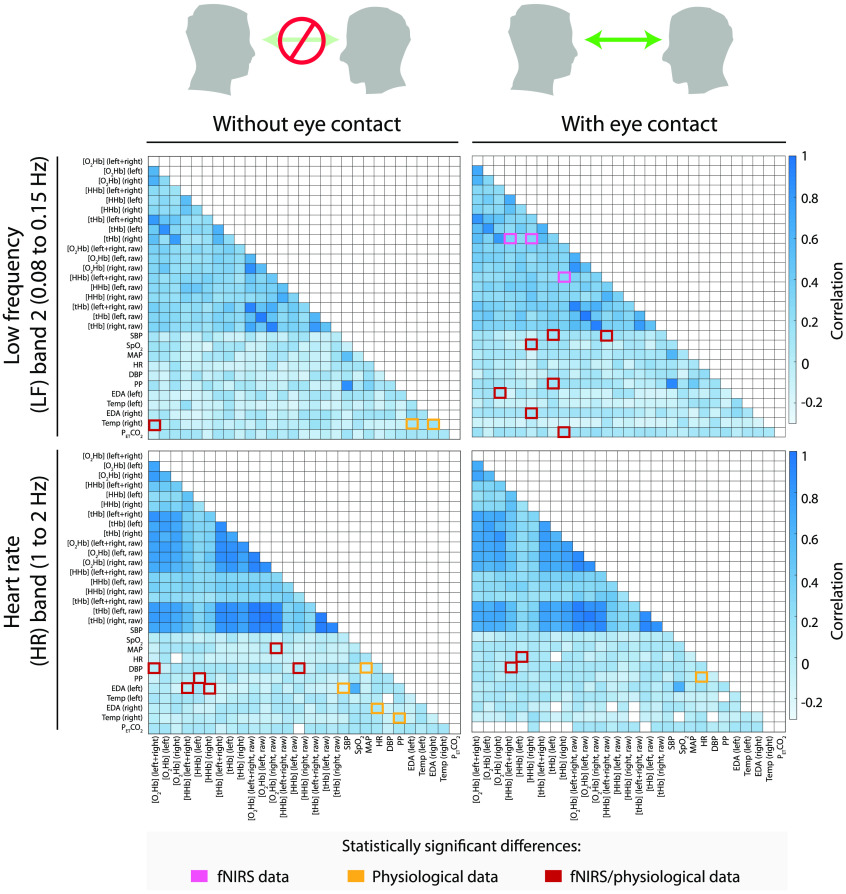
Fig. 5.
Group averages of the correlation matrices comparing the eyes-closed and eyes-open conditions in the LF2 band (top left and top right, respectively) and HR frequency band (bottom left and bottom right, respectively). In the two frequency bands, a marked matrix value index indicates a significant difference and a higher median of the distribution than the other condition of the respective frequency band.

