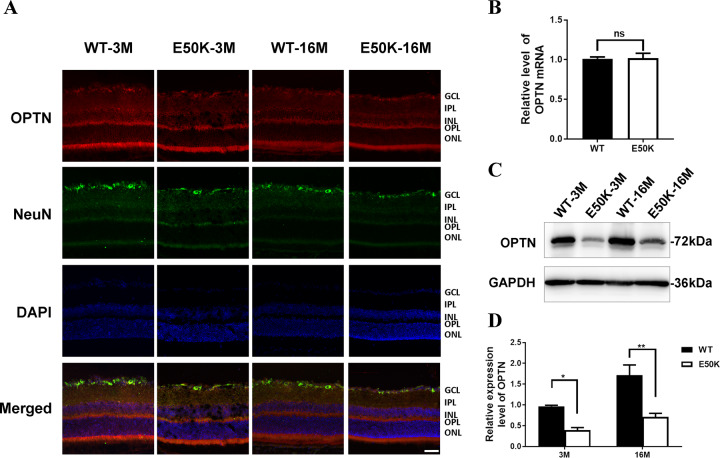
Fig. 3. OPTN expression in retina of WT and OPTN (E50K) mice.
A After frozen section was prepared, immunohistochemical method was used to mark OPTN protein in red and RGCs in green. DAPI was used to mark cell nuclear in blue. The red color indicated the distribution of OPTN protein in layers of retina. The green color labeled the soma of RGCs in retina. Scale bar, 50 μm. B The mRNA level of total OPTN was evaluated by RT-qPCR. Student’s t-test. C, D The protein level of total OPTN was determined by WB. The protein expression was compared by bands gray value. (*P < 0.05, **P < 0.01).

