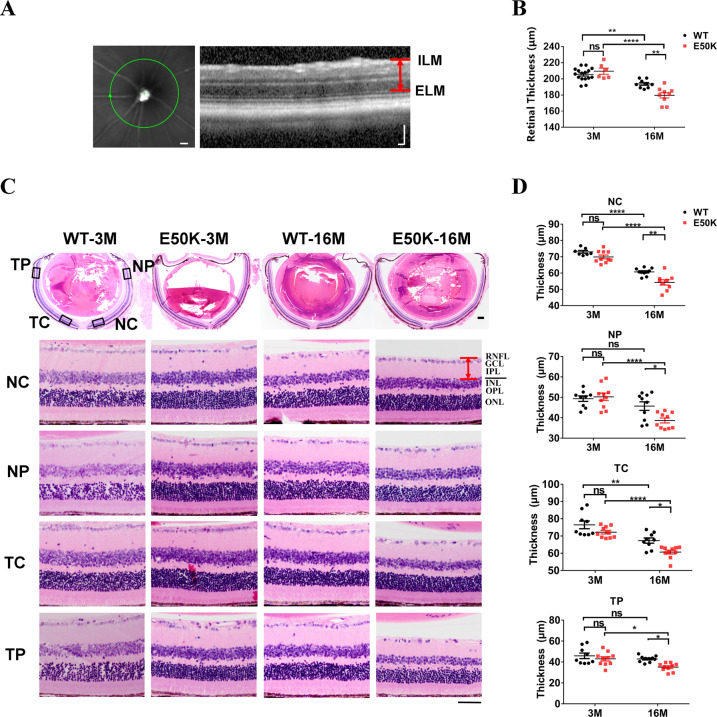
Fig. 4. Retina structural changes in WT and OPTN (E50K) mice.
A, B The retinal thickness was measured by PS-OCT. Scale bar in A, 500 μm (left panel), 100 μm (right panel). (E50K-16M, 179.7 ± 3.4, n = 9, WT-16M, 193.8 ± 1.7, n = 9, P < 0.01). C, D The paraffin section of retinal tissue was stained by H&E. According to the previous data, we found the inhomogeneity of retinal thickness. Therefore, four parts of NC (nasal center), NP (nasal periphery), TC (temporal center) and TP (temporal periphery) were grouped to measure the total thickness of retinal-associated layers (RNFL, GCL and IPL) in each retina sample. Scale bars in C, 200 μm (upper panel), 50 μm (lower panel). (NC: WT-16M, 60.7 ± 0.7, n = 10, E50K-16M, 54.3 ± 1.6, n = 9; NP: WT-16M, 45.7 ± 2.1, n = 10, E50K-16M, 38.7 ± 1.2, n = 10; TC: WT-16M, 67.4 ± 1.5, n = 9, E50K-16M, 60.7 ± 1.1, n = 10; TP: WT-16M, 42.9 ± 0.9, n = 10, E50K-16M, 35.1 ± 1.2, n = 10). (**P < 0.01, ***P < 0.001).

