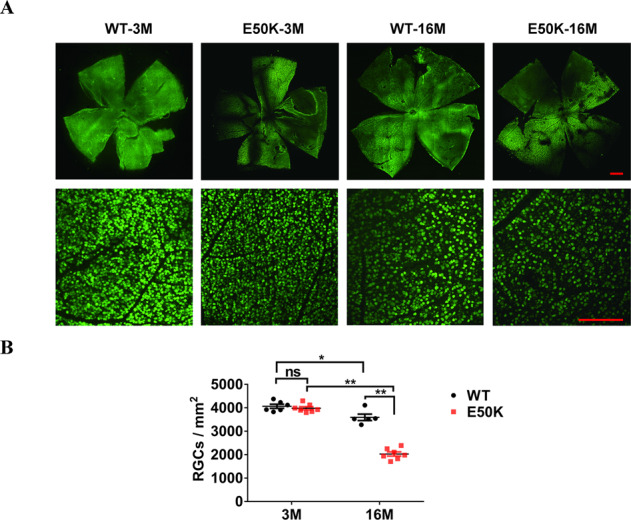
Fig. 5. RGCs quantification in WT and OPTN (E50K) mice.

A Based on flat mount of retina, RGCs was marked by NeuN in green, multiple tiled images were captured and then assembled into a mosaic image of the whole retina flat mount using a confocal fluorescence microscope. Scale bars, 500 μm (upper panel), 200 μm (lower panel). B Using ImageJ, the cell density of RGCs labeled in green was calculated (WT-3M, 4065.5 ± 87.5, n = 6, E50K-3M, 3982.0 ± 66.1, n = 7, WT-16M, 3594.8 ± 137.9, n = 5, E50K-16M, 2027.9 ± 90.0, n = 7, *P < 0.05, **P < 0.01).
