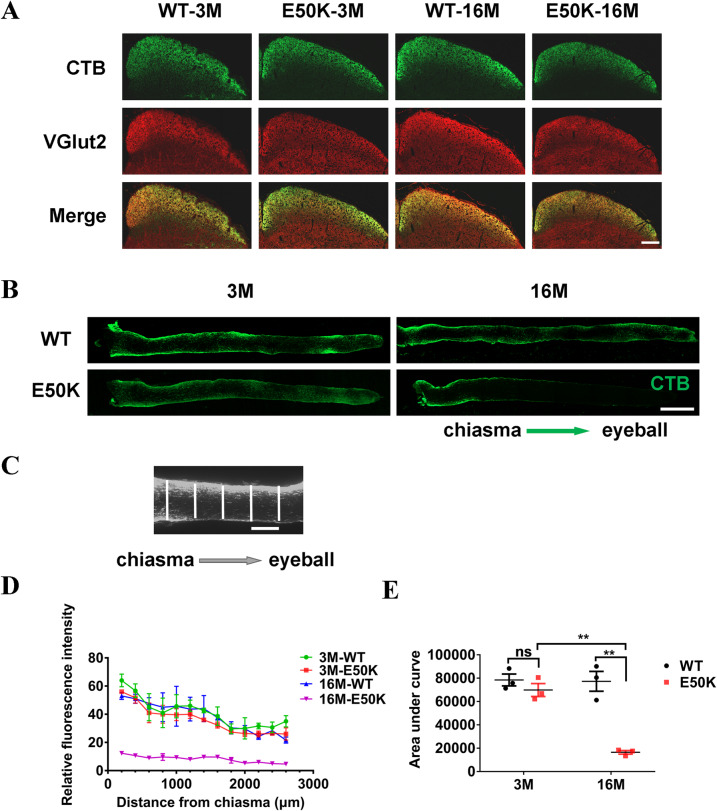
Fig. 6. Tracing the retrograde axonal transport in WT and OPTN (E50K) mice.
Frozen section of the SC was prepared 48 h after bilateral intravitreal injection of CTB-488. A The RGCs projection region in the SC was mapped by both CTB-488 (in green) transported from the eyes to the SC and VGluT2 (in red) expressed in SC. Scale bars, 200 μm. B, C CTB-488 was injected bilaterally into the SC. The relative fluorescence intensity across the width of the optic nerve at 100 µm intervals was quantified by ImageJ. Scale bars, 500 μm (B), 100 μm (C). D The relative fluorescence intensity indicated the quantity of transported CTB in optic nerves from chiasma to eyeball. E The area under the curve, based on graphed fluorescence intensity against distance (along the nerve), was computed using Prism (WT-3M, 78466.7 ± 5085.3, E50K-3M, 69833.3 ± 5510.3, WT-16M, 77266.7 ± 8497.9, E50K-16M, 16433.3 ± 1538.7, n = 3/group). (**P < 0.01).

