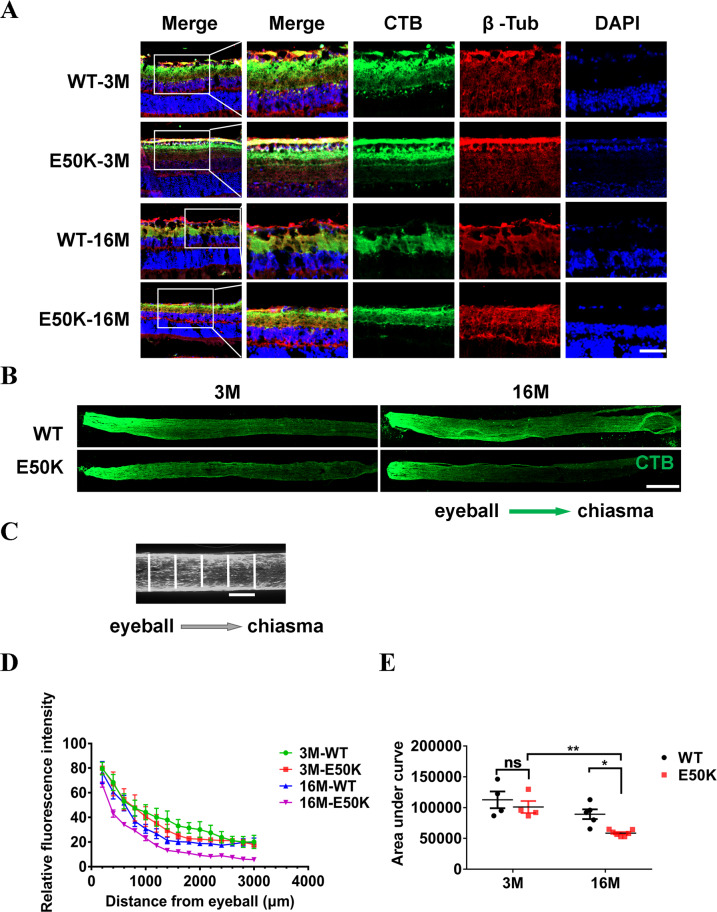
Fig. 7. Tracing the anterograde axonal transport in WT and OPTN (E50K) mice.
Frozen section of retina and optic nerve was prepared 48 h after bilateral intravitreal injection of CTB-488. A CTB-488 distribution in retinas and the microtubules of RGCs were marked by β-tubulin. Scale bars, 50 μm. B, C The relative fluorescence intensity across the width of the optic nerve at 100 µm intervals was quantified by ImageJ. Scale bars, 500 μm (B) and 100 μm (C). D The relative fluorescence intensity indicated the quantity of transported CTB in optic nerves from eyeball to chiasma. E The area under the curve, based on graphed fluorescence intensity against distance (along the nerve), was computed using Prism (WT-3M, 112669.5 ± 13560.3, n = 4, E50K-3M, 101053.0 ± 9761.1, n = 4, WT-16M, 89293.4 ± 7952.8, n = 5, E50K-16M, 58584.3 ± 1869.0, n = 7). (*P < 0.05, **P < 0.01).

