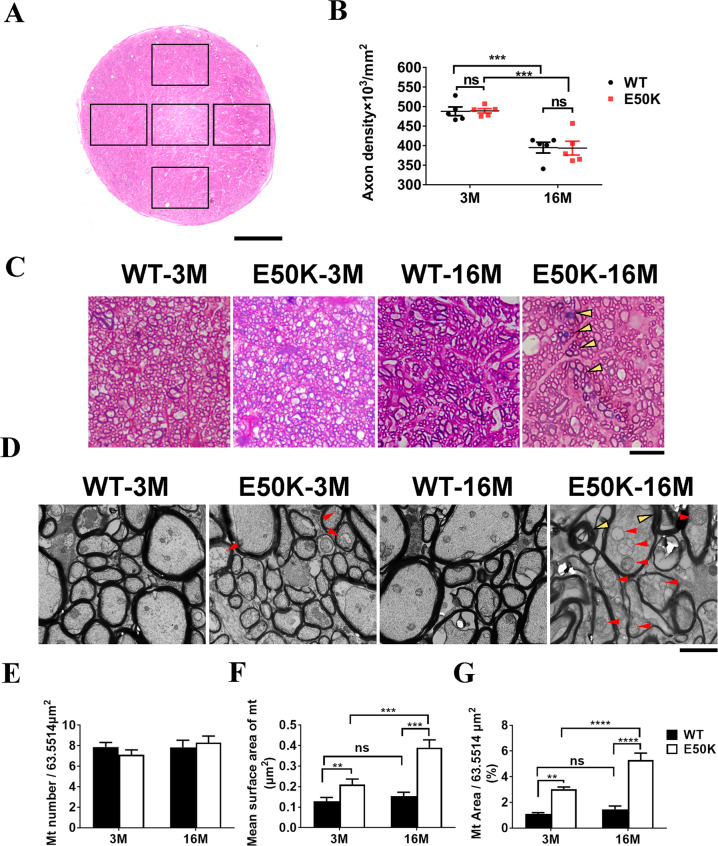
Fig. 8. The axonal degeneration in optic nerves of OPTN (E50K) mice.
A–C The semi-thin (500 nm) cross section of the optic nerve was stained with methylene-Azure II blue and basic fuchsin, then the section was visualized and photographed under a light microscope. The density of axons in each field was computed by Axon J. Scale bar in A indicated 50 μm. The axon density of each group was analyzed by Prism (WT-3M vs. E50K- 3M, 487.9 ± 11.2 vs. 489.2 ± 5.6, P > 0.05; WT-16M vs. E50K-16M, 395.0 ± 13.7 vs. 393.7 ± 17.6, P > 0.05, n = 5/group). B WT mice and E50K mice-3M showed normal fascicle packing and regular myelin wraps on axons in optic nerves. Disrupted axon fascicles were found in samples from E50K mice-16M (black arrowheads). Scale bar indicated 10 μm (C). D–G Ultra-thin sections (70 nm) were prepared in a standardized procedure for electron microscope investigation. Abnormal myelin profiles (yellow arrowheads) were found in E50K mice-16M, whereas swollen mitochondria with cristae loss (red arrowheads) were found not only in E50K mice-16M but also in E50K-3M (D). The mitochondrial number in single fields (P > 0.05) (E), the mean surface area of mitochondria (WT-3M, 0.11 ± 0.01, E50K-3M, 0.2 ± 0.02, WT-16M, 0.23 ± 0.01, E50K-16M, 0.31 ± 0.02) (F) and the proportion of mitochondria area (WT-3M, 1.09 ± 0.1, E50K-3M, 3.01 ± 0.18, WT-16M, 1.46 ± 0.26, E50K-16M, 5.29 ± 0.55) (G) in a single field were calculated by ImageJ to evaluated the condition of mitochondria in axons. Scale bar in D, 2 μm. (n = 5/group, **P < 0.01, ***P < 0.001, ****P < 0.0001).

