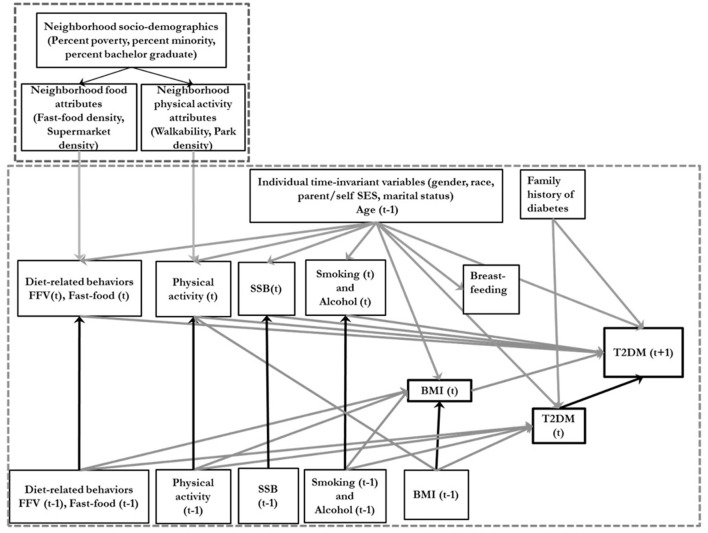
Figure 1.
Conceptual directed acyclic diagram underlying the data-generating process. SSB, sugar-sweetened beverage consumption; BMI, body mass index; FFV, Fresh fruit and vegetable consumption; T2DM, type 2 diabetes; Ado, Adolescence. T is an index of time. The smaller dotted square represents the neighborhood variables and the larger dotted square represents the individual level variables.

