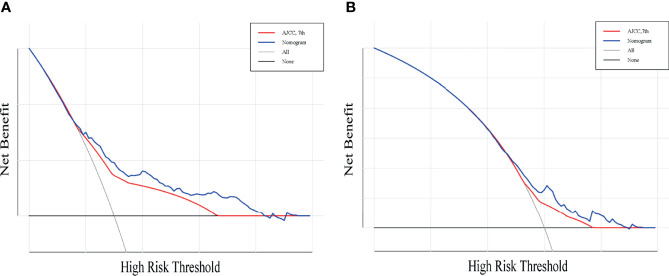
Figure 6.
Decision curve analysis for the nomogram and AJCC stage in the prediction of prognosis of patients with penile cancer. The Decision curve analysis of the 3-year OS (A) and 5-year OS (B). The x-axis shows the threshold probabilities, and the y-axis measures the net benefit calculated by adding the true positives and subtracting the false positives.

