Figure 6.
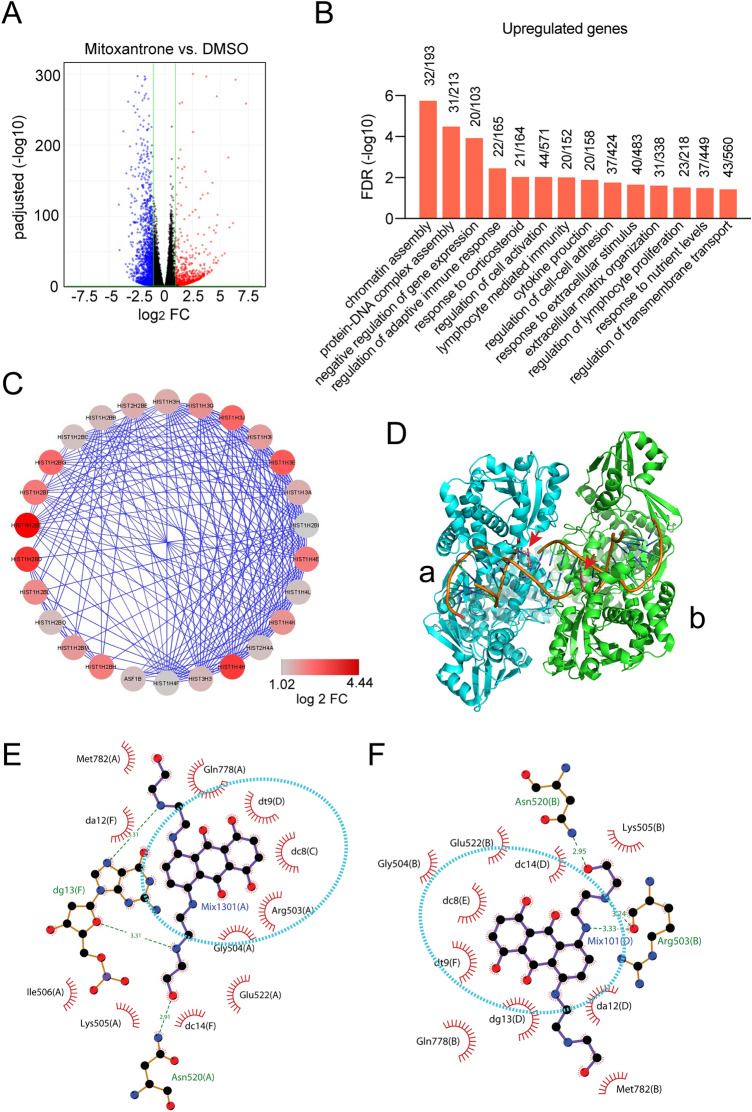
Gene expression profiling shows two major cellular targets of Mitoxantrone. (A) A volcano plot showing genes upregulated or downregulated by Mitoxantrone in HEK293T cells. (B) A list of significant pathways upregulated by Mitoxantrone. (C) Genes encoding nucleosome proteins are highly upregulated by Mitoxantrone. Shown is a gene interaction network highlighting nucleosome assembly-related genes induced by Mitoxantrone. Colors indicate fold change. (D) A crystal structure shows the binding of Mitoxantrone to a DNA-topoisomerase complex. Arrows indicate the two Mitoxantrone molecules each associated with a topoisomerase monomer. (E,F) LigPlot views of the molecular interactions between Mitoxantrone and the DNA-topoisomerase complex.

