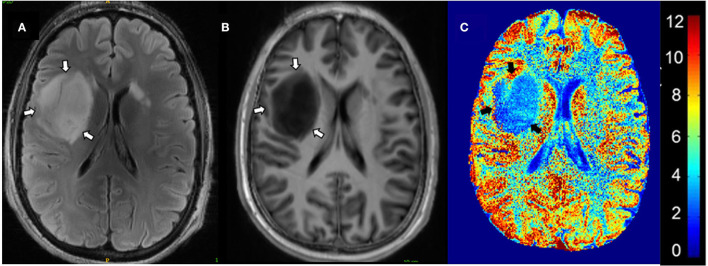
Figure 4.
Glutamate-CEST imaging of a diffuse astrocytoma. (A) 3T FLAIR with tumors identified by white arrows. (B) 7T FLAIR with tumors identified by white arrows. (C) Glutamate-CEST contrast map with tumors identified by black arrows and CEST contrast gradient on the right. Figure used with permission from Neal et al., 2019 (60).

