
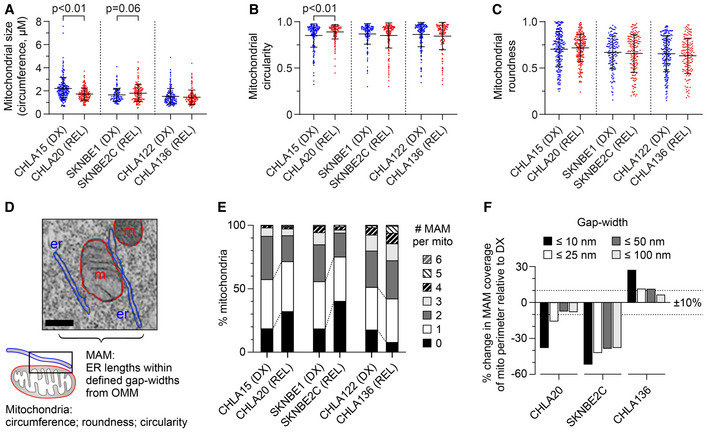
Figure 3. REL neuroblastomas have reduced mitochondria‐associated membranes compared with patient‐matched tumors from DX.
-
A–CTransmission electron microscopy image analysis was used to quantify mitochondrial size, circularity, and roundness in DX/REL neuroblastoma pairs (mean ± SD shown).
-
DElectron micrograph illustrating organelle masking of MAM interfaces; scale bar = 500 nm.
-
EProportion of mitochondria with 0–6 or more MAMs are shown for each cell line, as DX/REL pairs.
-
FPercentage of mitochondria perimeter with an apposed ER within defined gap widths for DX/REL neuroblastoma cell line pairs; dotted lines denote +10% and −10% change.
Data information: For A–C and E, F, n = 137–241 mitochondria per cell line; er, endoplasmic reticulum; m, mitochondria. For A‐C, statistical analyses were performed using a two‐tailed Mann–Whitney U test, with significance P < 0.05 (trend P < 0.10).