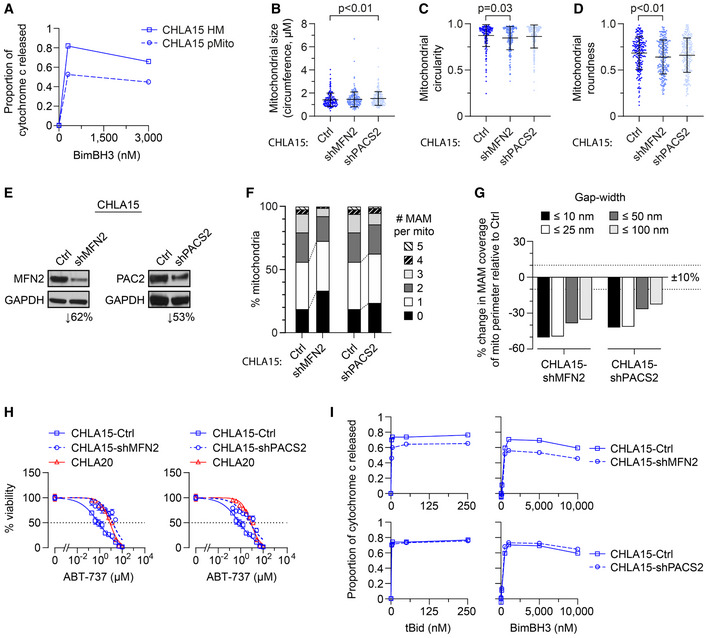
Figure 4. Chemically or genetically reducing MAMs leads to MOMP resistance.

-
AHeavy‐membrane (HM) fractions of CHLA15 were rendered MAM depleted by immunomagnetic separation to derive purified mitochondria (pMito), and cytochrome c release measured in response to BimBH3 peptide.
-
B–DTEM analyses were used to quantify mitochondrial size, circularity, and roundness in CHLA15 cells transfected with a sh‐control (Ctrl), shMFN2 or shPACS2 constructs (mean ± SD shown).
-
EImmunoblot assessment of Mfn2 and Pacs2 protein knockdown.
-
FProportion of mitochondria with 0–5 MAMs are shown for each.
-
GPercentage of mitochondria perimeter with an apposed ER within defined gap widths; dotted lines denote +10% and −10% change.
-
HIn vitro viability of CHLA15‐ctrl, CHLA15‐shMFN2, CHLA15‐shPACS2, and CHLA20 cells following 72 h exposure to ABT‐737; dotted line represents 50% viability.
-
IMitochondrial cytochrome c release in response to tBid and BimBH3 peptide in CHLA15‐Ctrl, CHLA15‐shMFN2, and CHLA15‐shPACS2 cells.
Data information: For B–D and F, G, n = 214–246 mitochondria per cell line. For A and I, data points are mean of duplicate wells (SD < 0.05 at all points) in a representative experiment from at least two biological replicates; for H, data points are mean and SD from triplicate wells, experiments, are representative of at least two biological replicates. For B–D, statistical analyses were performed using a two‐tailed Mann–Whitney U test, with significance P < 0.05.
