
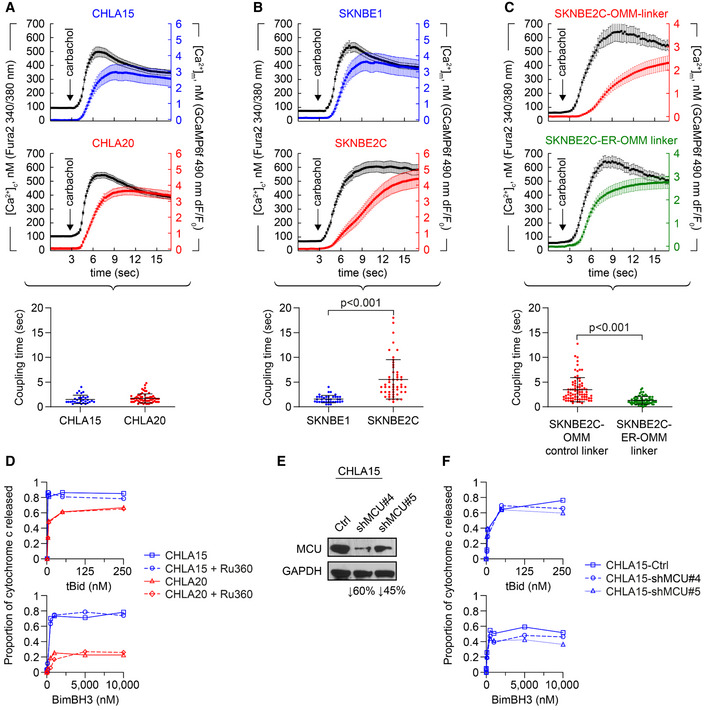
Figure 5. Reduced Ca2+ transfer at MAMs is not required for attenuated mitochondrial responses to stress.
-
A, BCytosolic (black tracing) and mitochondrial (colored tracing) Ca2+ concentration measured using fluorescent reporters in the CHLA15 (n = 29 cells)/CHLA20 (n = 65 cells) and SKNBE1 (n = 37 cells)/SKNBE2C (n = 52 cells) pairs. ER Ca2+ release was induced by 100 μM carbachol, an IP3R‐agonist; time added indicated by arrow; tracings are mean ± SD error bars. Coupling time (time between achieving 50% of maximal cytosolic and mitochondrial concentrations) is an index of ER–mitochondrial proximity and transfer efficiency; plotted below.
-
CMAM proximity was enforced in SKNBE2C cells using an ER‐OMM linker construct, with Ca2+ transfer coupling time (n = 57 cells) compared with cells expressing an OMM‐only control linker (n = 70 cells); tracings are mean ± SEM error bars.
-
DMitochondrial cytochrome c release for CHLA15 and CHLA20 cells following exposure to tBid or BimBH3 peptide, with or without Ru360 treatment.
-
ESilencing of the mitochondrial calcium uniporter (MCU) was achieved in two CHLA15‐shMCU clones.
-
FCytochrome c release in response to tBid and BimBH3 assessed.
Data information: For A–C, data are derived from at least three separate cell transfections (biological replicates). For D and F, data points are mean of duplicate wells (SD < 0.05 at all points) in a representative experiment from at least two biological replicates. For A–C, statistical analyses were performed using an unpaired two‐sided Student’s t‐test, with significance P < 0.05.