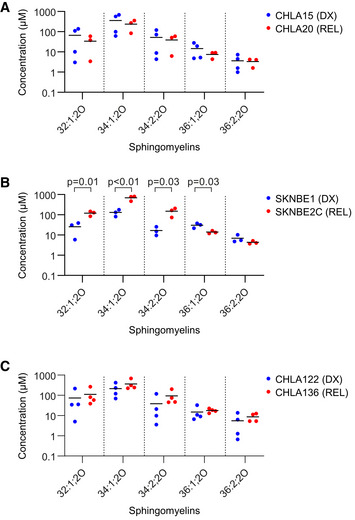
Figure EV5. Sphingomyelin concentrations in DX/REL neuroblastoma cells.

-
A–CConcentration of sphingomyelin species as measured by LC/MS from DX and REL pair whole‐cell pellets. Data information: three to four biological replicates plotted per cell line; three technical replicates each; statistical analyses were performed using an unpaired two‐sided Student’s t‐test, with significance P < 0.05.
